Biology figures for your tests and worksheets
Make one to fit your lesson, then copy it straight into your document. Free, with no sign-up.
-
Population Growth
J- and S-shaped growth curves, as numbers or per capita rates.
-
Punnett Square
Any cross from Tt × Tt to X-linked, filled in or left for students.
-
Pedigree
A random family for any inheritance mode, or one you change by hand.
-
Predator–Prey Cycles
Predator and prey populations rising and falling out of step.
-
Enzyme Activity
Rate of reaction against temperature, pH or substrate concentration.
-
DNA and Protein Synthesis
A DNA strand transcribed and translated, base under base, with any row left for students.
-
Photosynthesis Rate
Limiting factors: the rate against light, CO₂ or temperature.
-
Osmosis and Tonicity
Cells, U-tubes and dialysis bags in hypotonic, isotonic and hypertonic solutions.
-
Gel Electrophoresis
An agarose gel with a DNA ladder and the band sizes you type.
-
Micropipette Reading
A micropipette’s volume display, set to the volume you type.
-
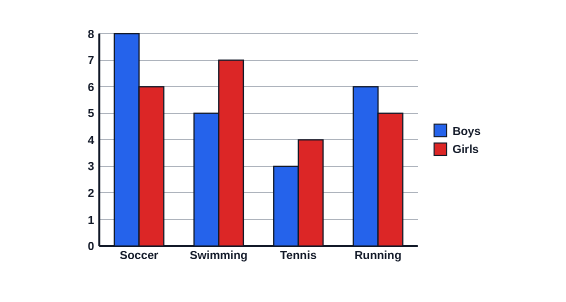
Bar Graph Generator
Bar graphs and column graphs from a table, with one or several bars per category.
Math Figures -
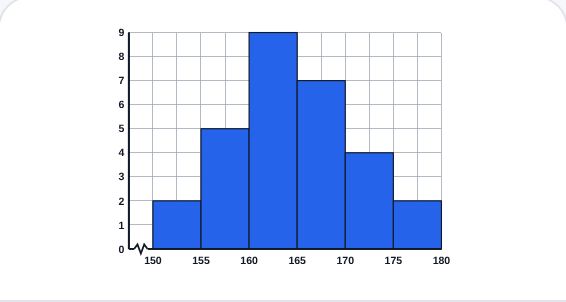
Histogram Generator
Histograms from a data set or a frequency table, with equal or unequal bins.
Math Figures -
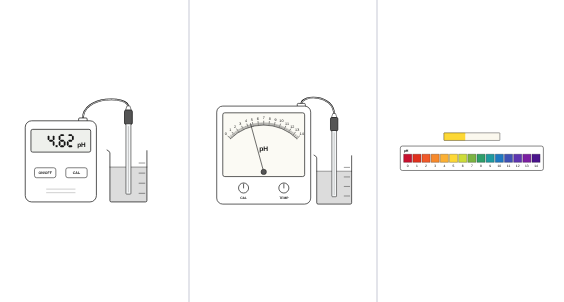
pH Reading
A digital or analog pH meter, or pH paper, showing the pH you type.
Chemistry Figures -
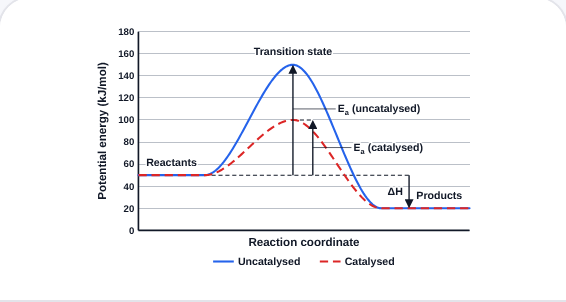
Potential Energy Diagram
A reaction energy profile from the energies you type, with Ea and ΔH, a catalyst or several steps.
Chemistry Figures