
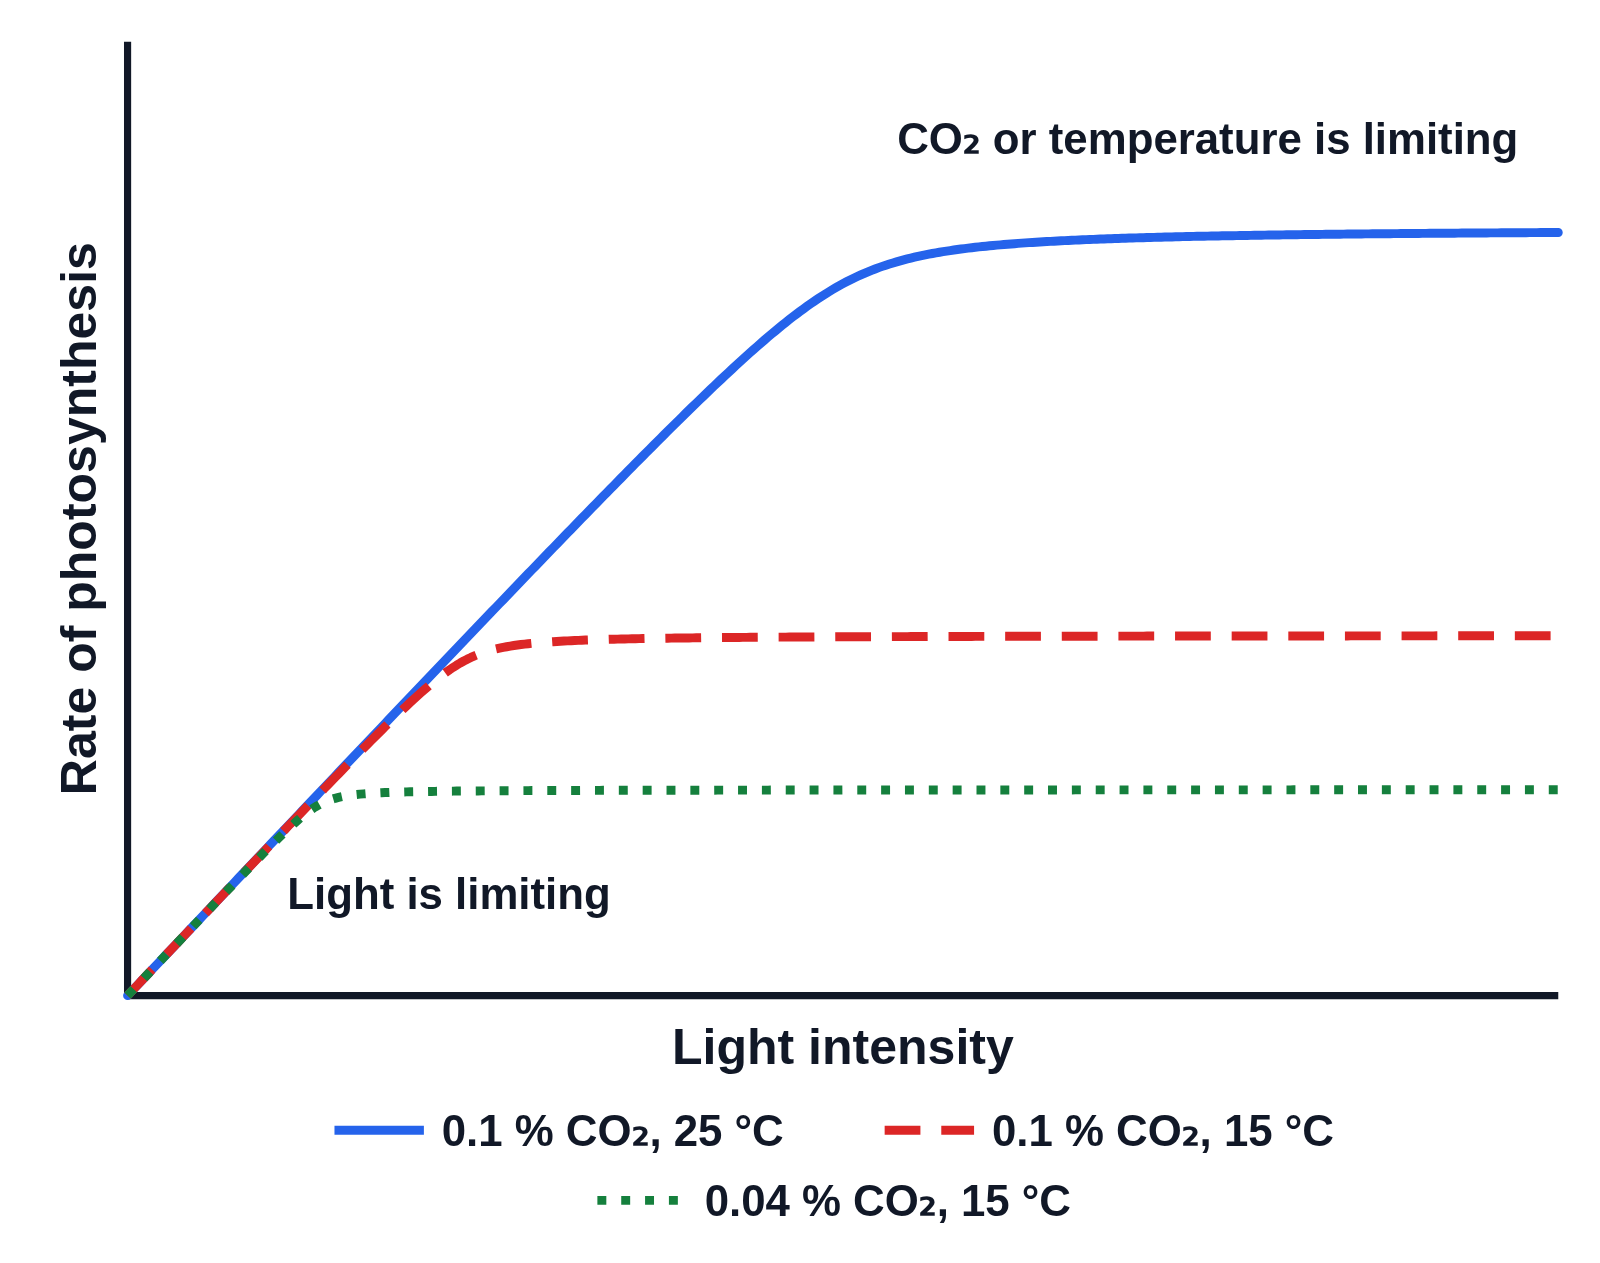
Limiting factors in photosynthesis: rate against light intensity at different CO₂ and temperatures
An example figure from the Photosynthesis Rate generator.
Editing opens it in Photosynthesis Rate with these settings, to change anything and copy or download your own.
Answer key
- 0.1 % CO₂, 25 °C: light is limiting up to a light intensity of about 41, then the rate levels off at 9.8
- 0.1 % CO₂, 15 °C: light is limiting up to a light intensity of about 19, then the rate levels off at 4.6
- 0.04 % CO₂, 15 °C: light is limiting up to a light intensity of about 11, then the rate levels off at 2.6
Free to use in your tests, worksheets, slides or anything else, no credit needed. Public domain under CC0 1.0. How to reuse our figures
More Photosynthesis Rate examples
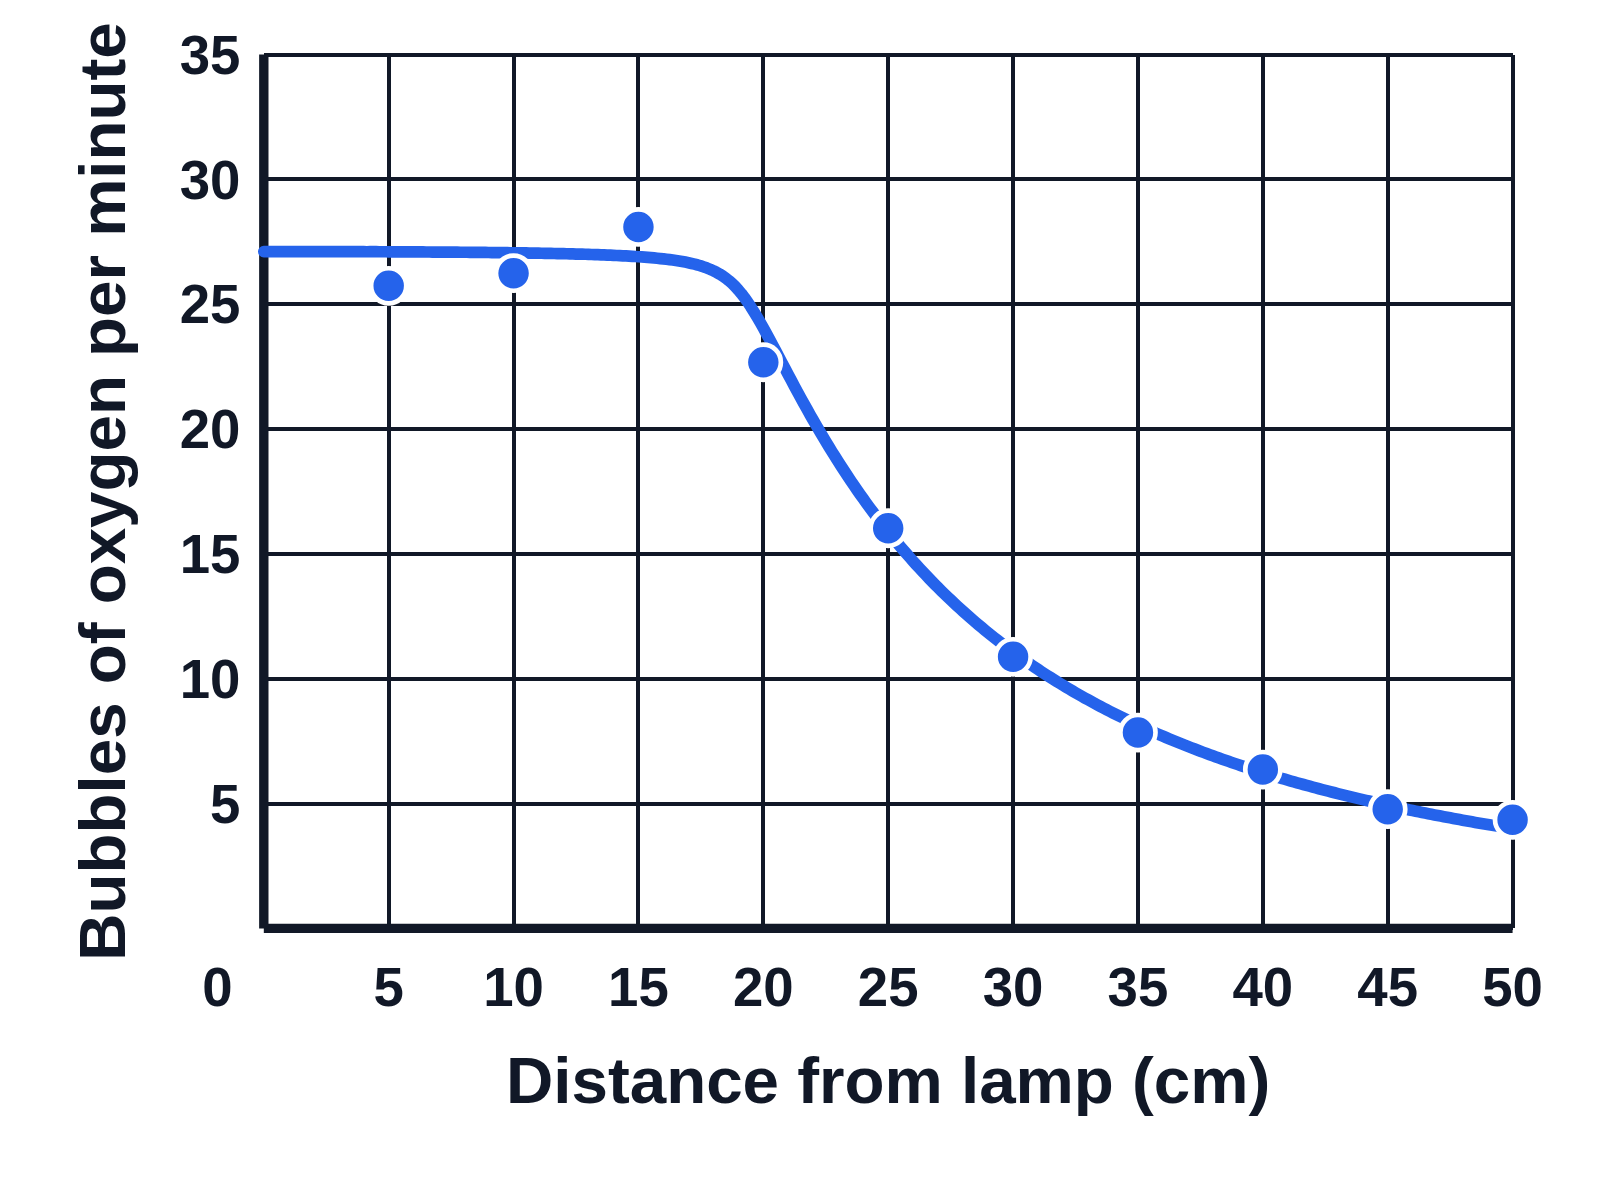 Pondweed and lamp distance: bubbles of oxygen per minute against distance from the lamp
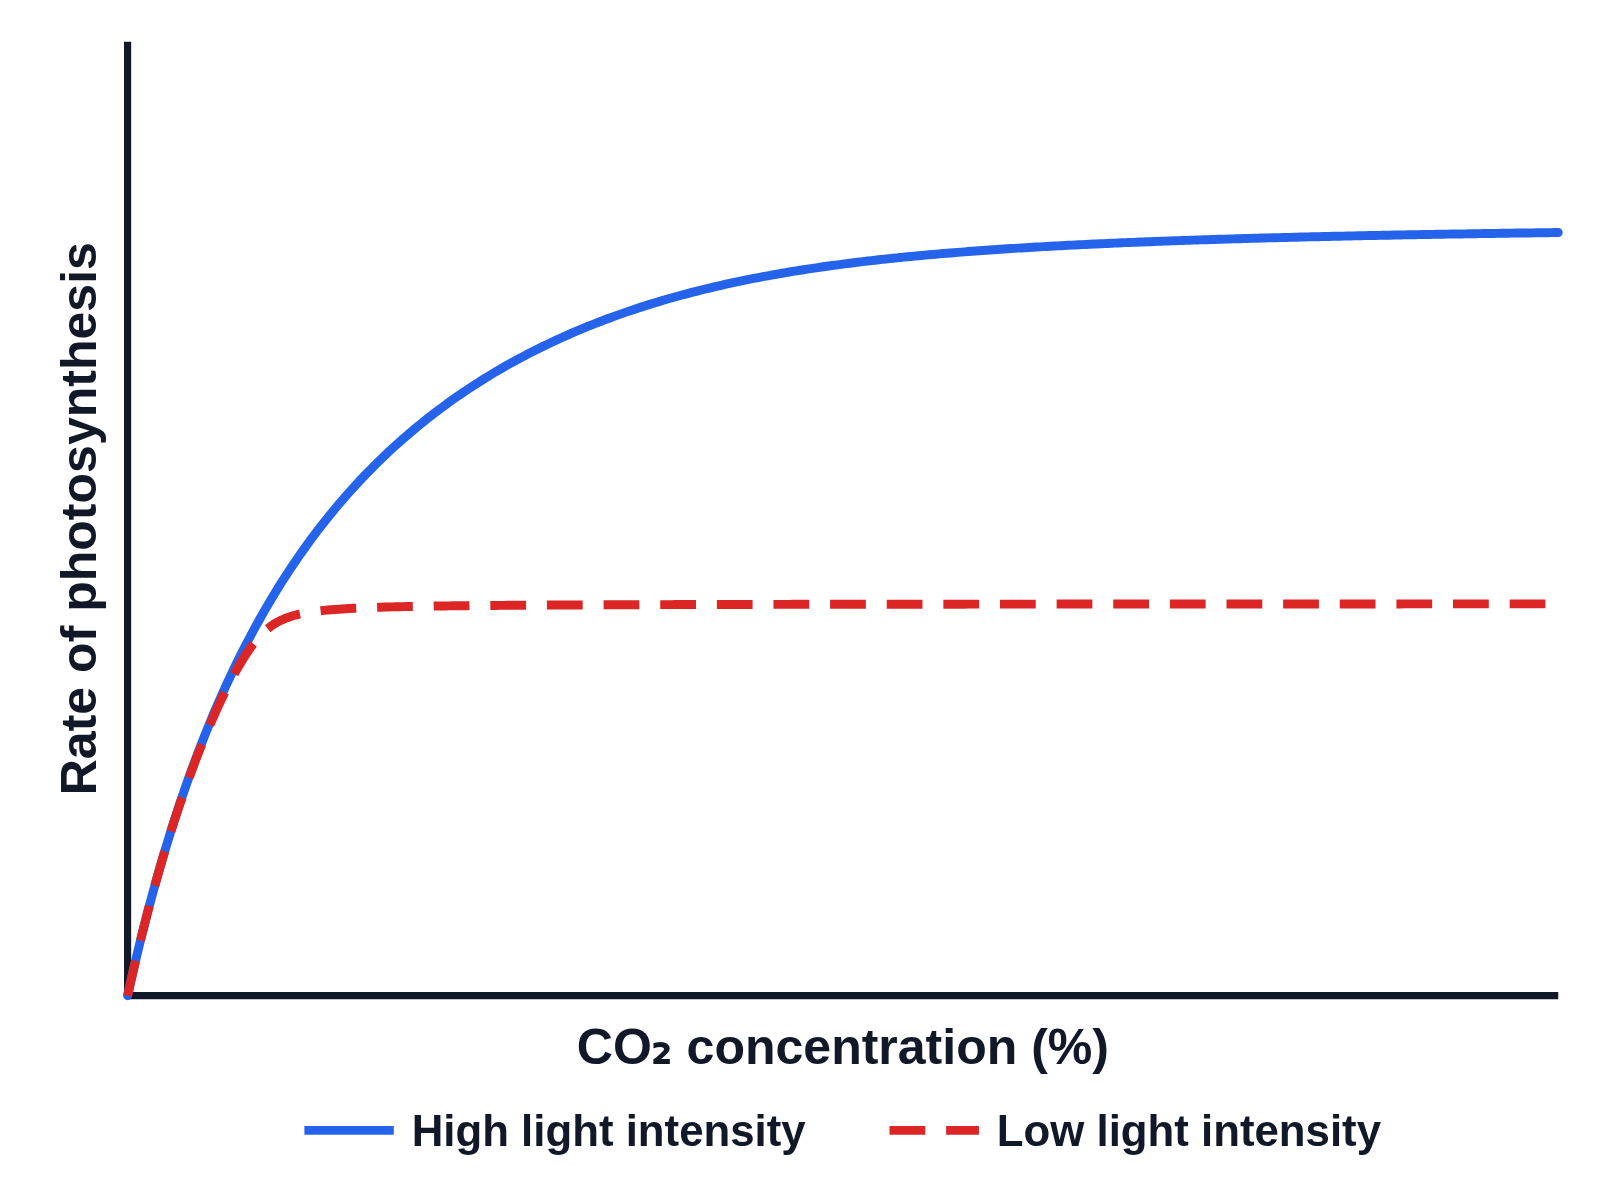 Rate of photosynthesis against CO₂ concentration at high and low light intensity
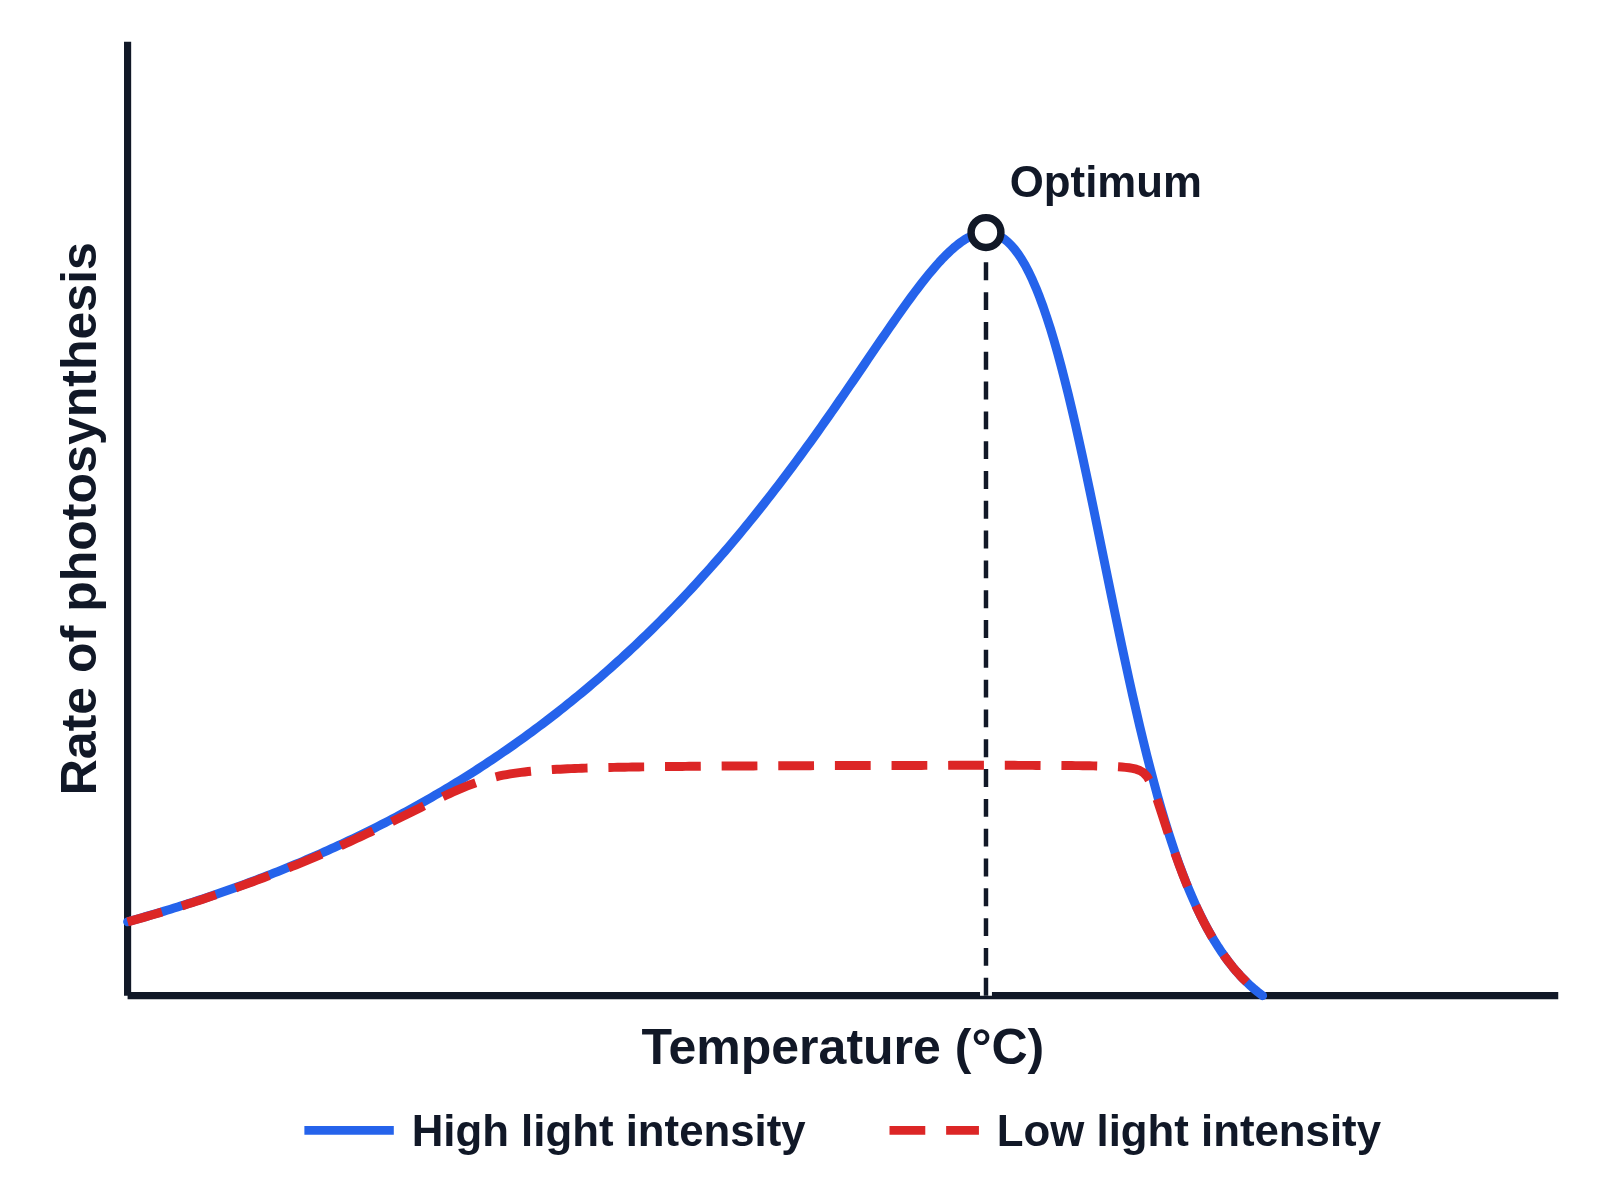 Rate of photosynthesis against temperature at high and low light intensity
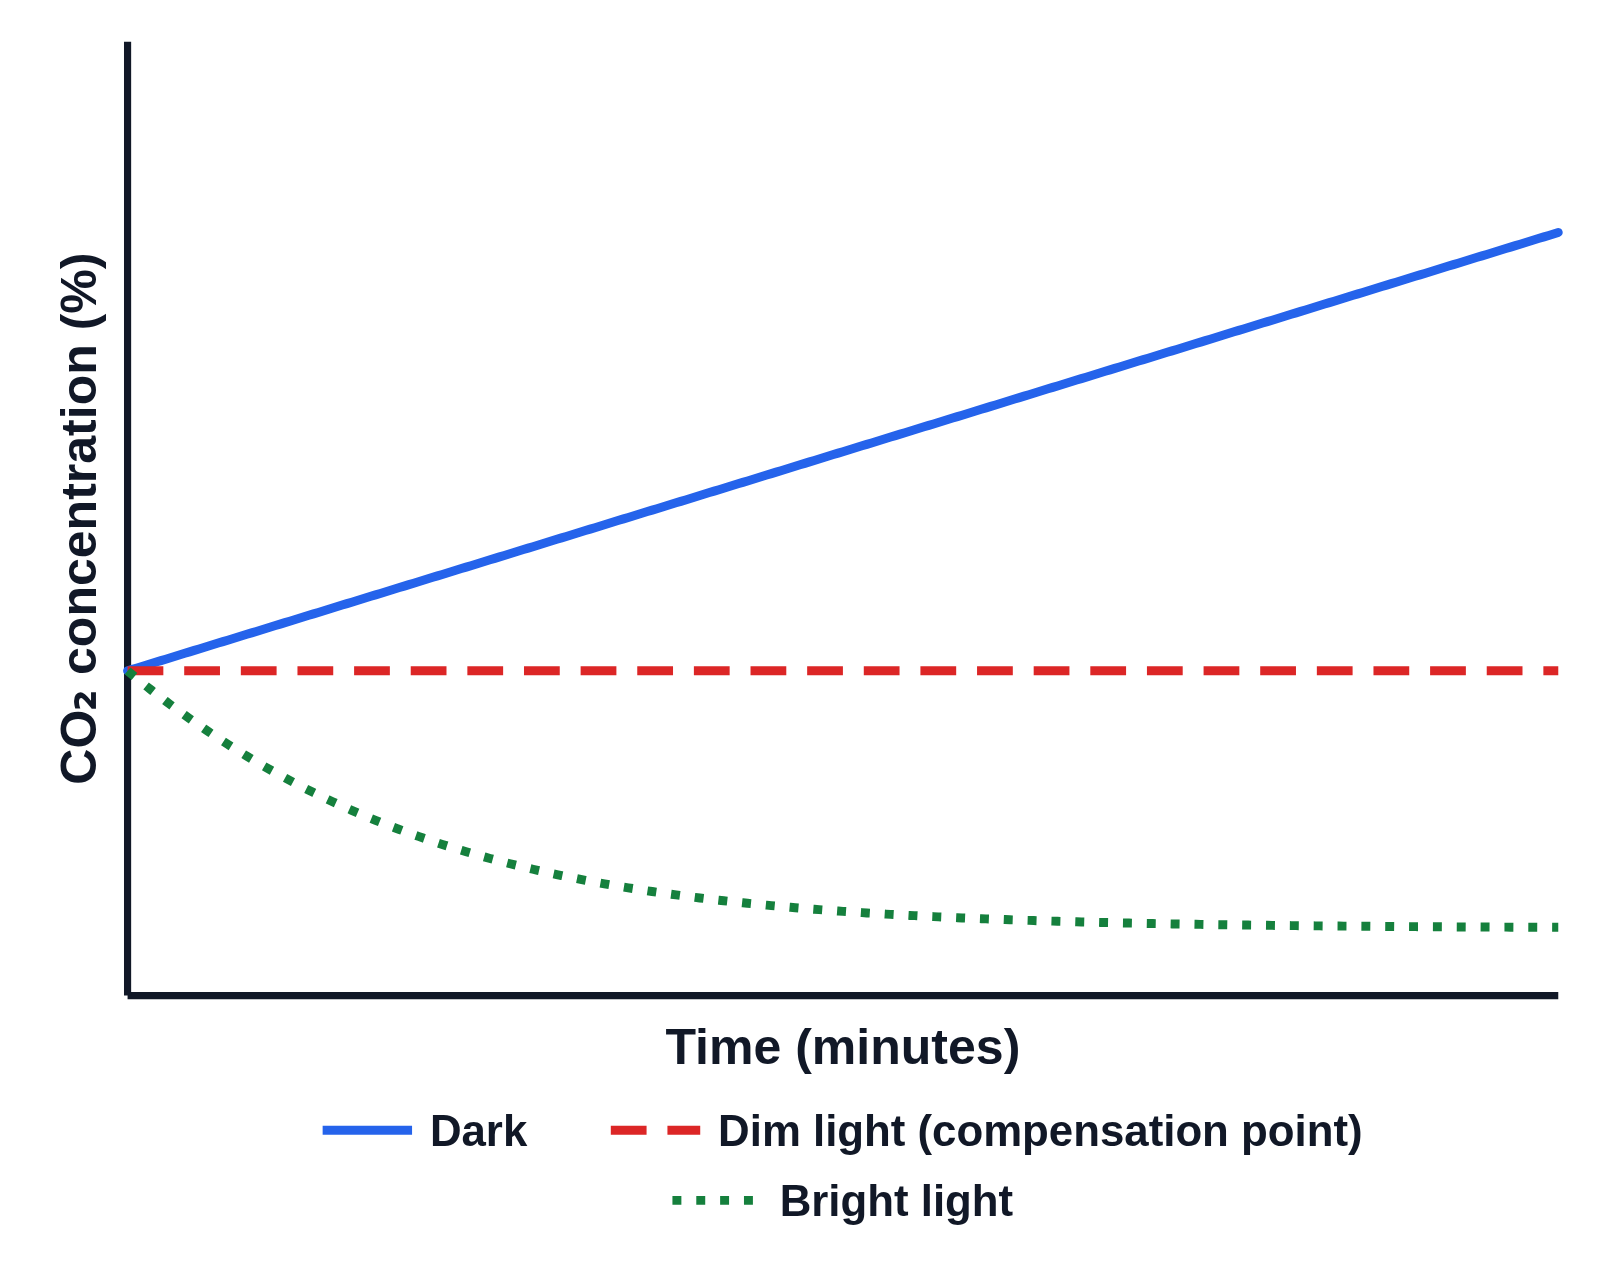 CO₂ concentration in a closed chamber in the dark, dim and bright light
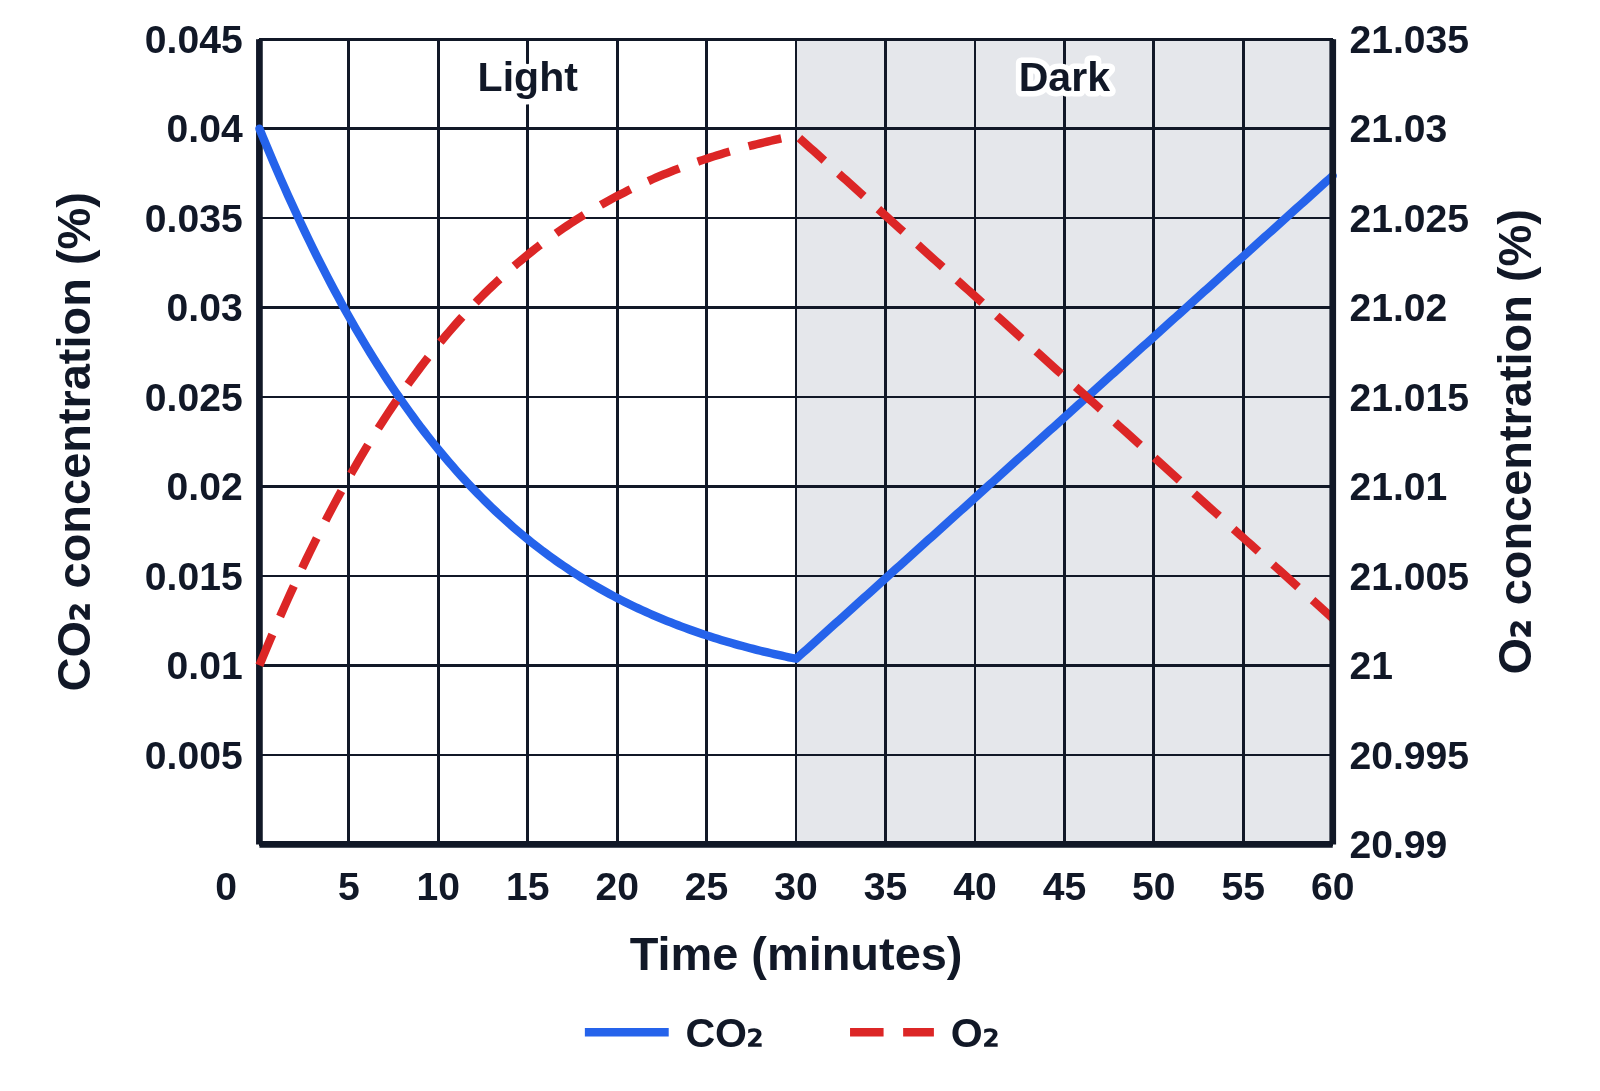 CO₂ and O₂ concentration around a plant in the light and then the dark
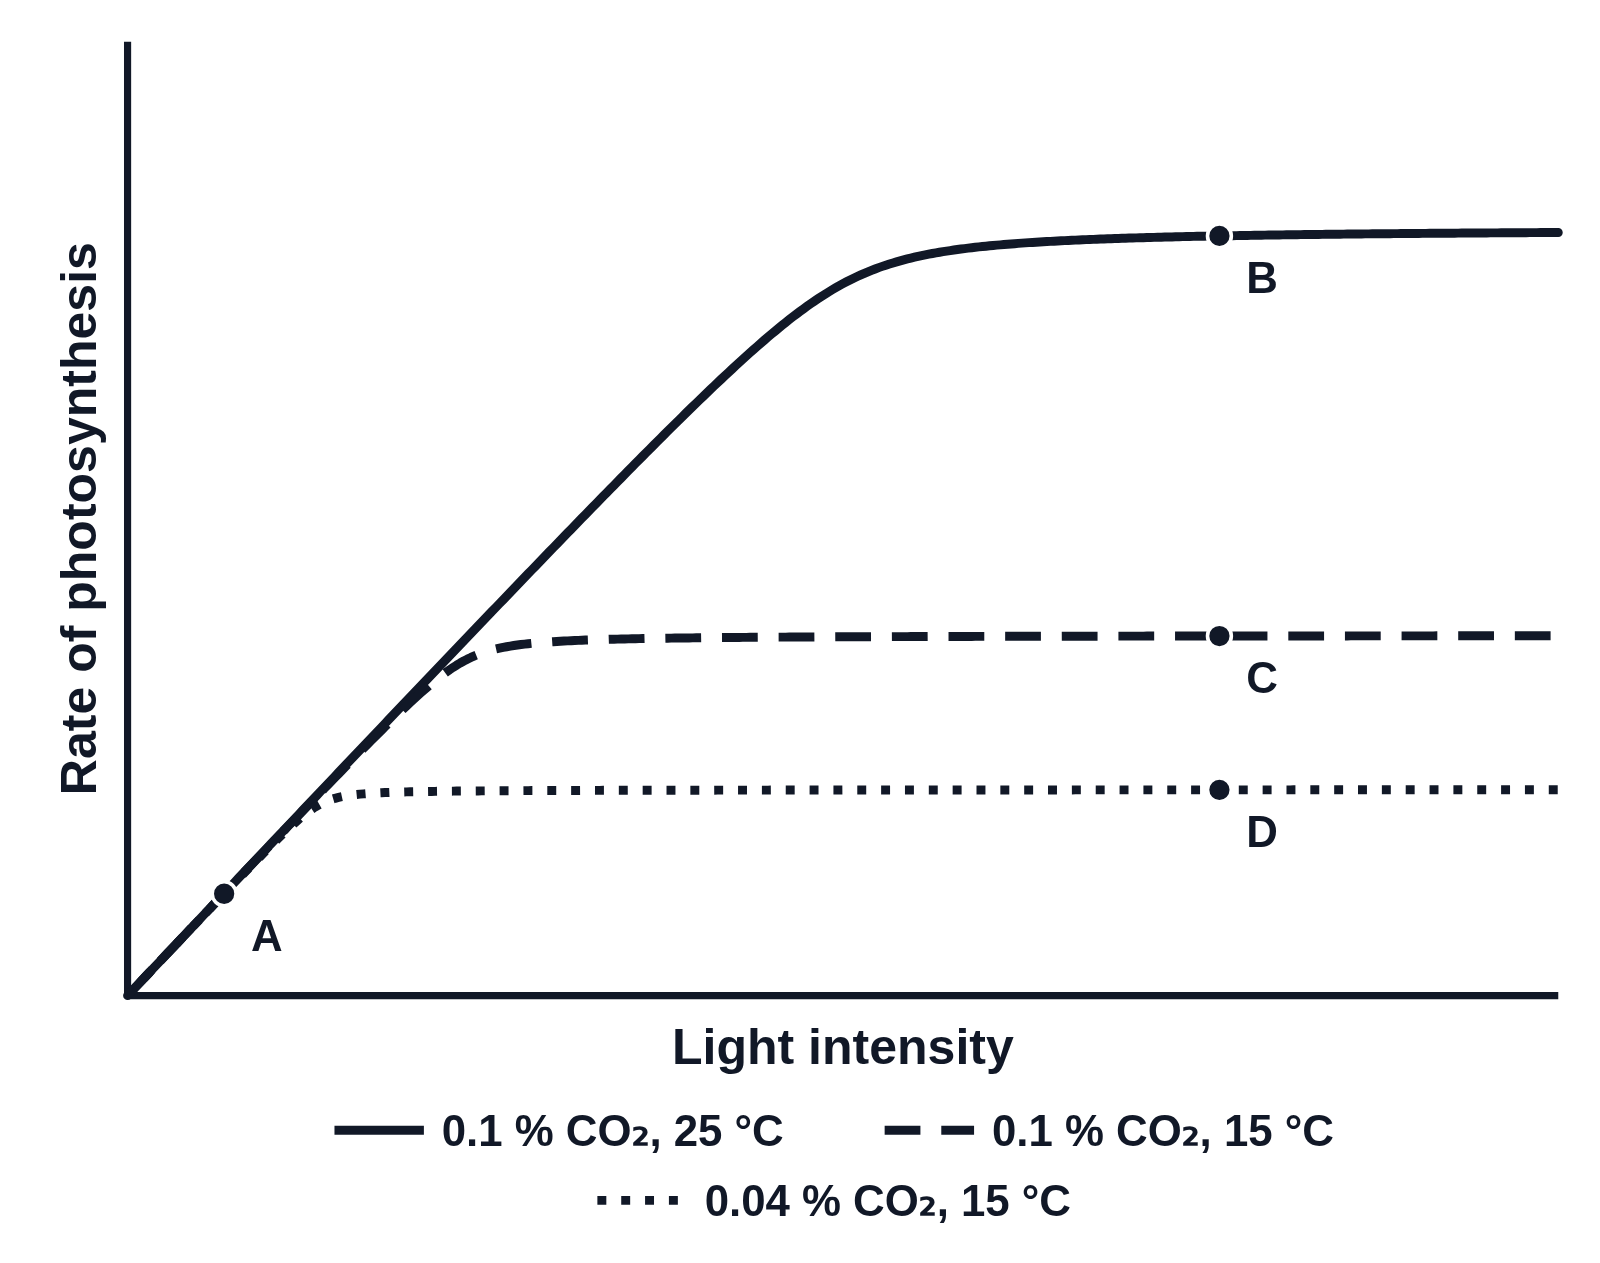 Limiting factors worksheet: what limits the rate of photosynthesis at A, B, C and D?