Moose and wolf population cycles graph (Isle Royale)

An example figure from the Predator–Prey Cycles generator.
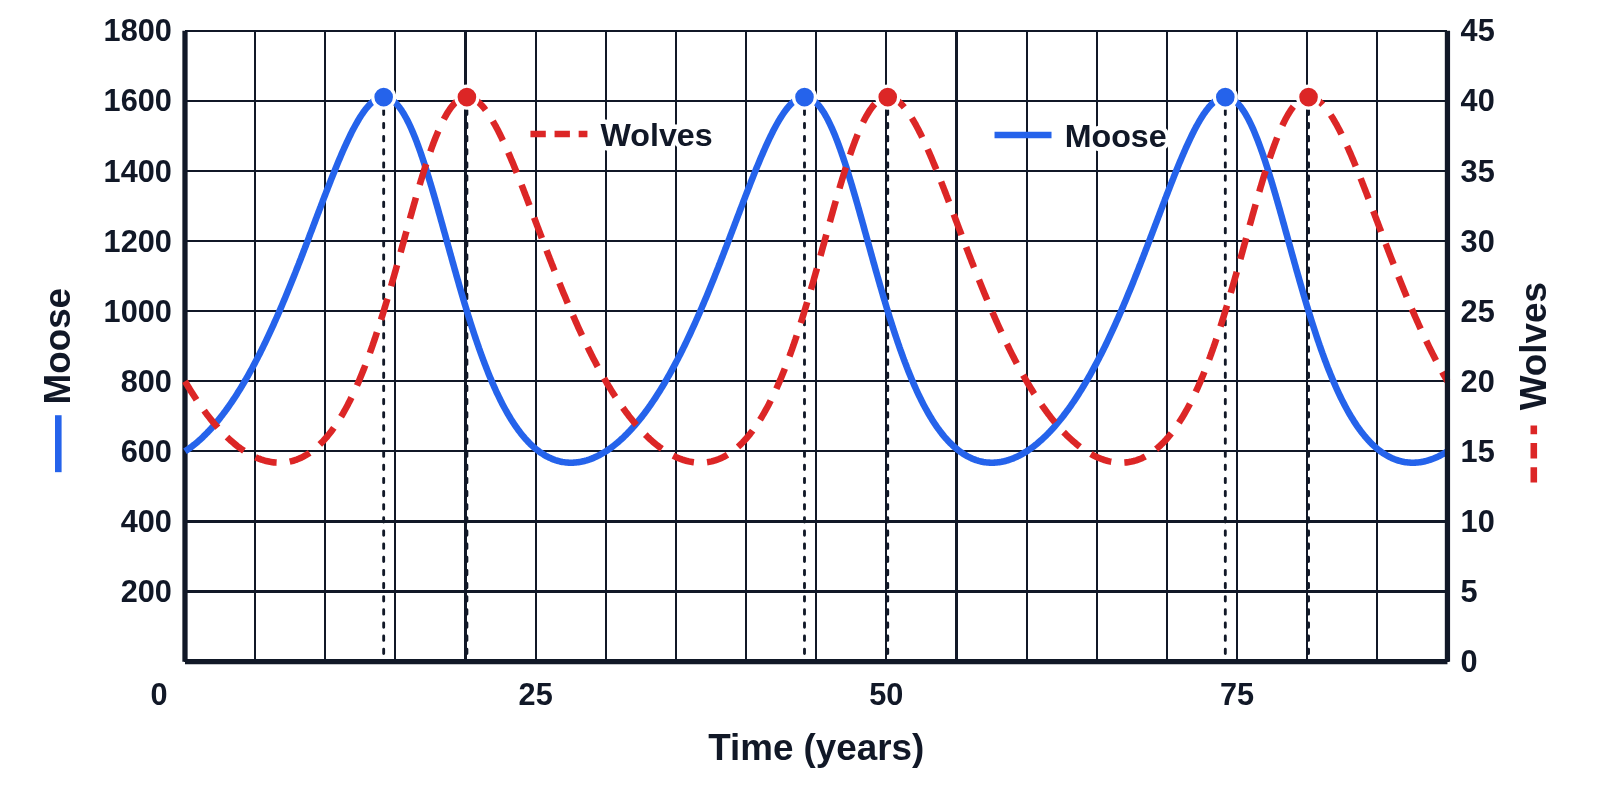
Graph of moose (solid blue line, left axis 0 to 1800) and wolves (dashed red line, right axis 0 to 45) over 90 years, three cycles, each peak marked with a dot and a dotted line down to the time axis
Moose (solid blue) and wolves (dashed red) over 90 years, moose on the left axis and wolves on the right, from the model with classroom numbers for the moose and wolves of Isle Royale rather than real counts. The cycle is long and slow, the wolves peaking several years after the moose, and every peak is marked with a dot and a dotted line down to the time axis so students can read when it happens.

Editing opens it in Predator–Prey Cycles with these settings, to change anything and copy or download your own.

Answer key

  • Period: a cycle every 30 years
  • Lag: the wolves peak 5.9 years after the moose
  • Moose: 568 to 1611, averaging 1000
  • Wolves: 14.2 to 40.3, averaging 25

Free to use in your tests, worksheets, slides or anything else. Open source under Apache 2.0. How to reuse our figures
More Predator–Prey Cycles examples