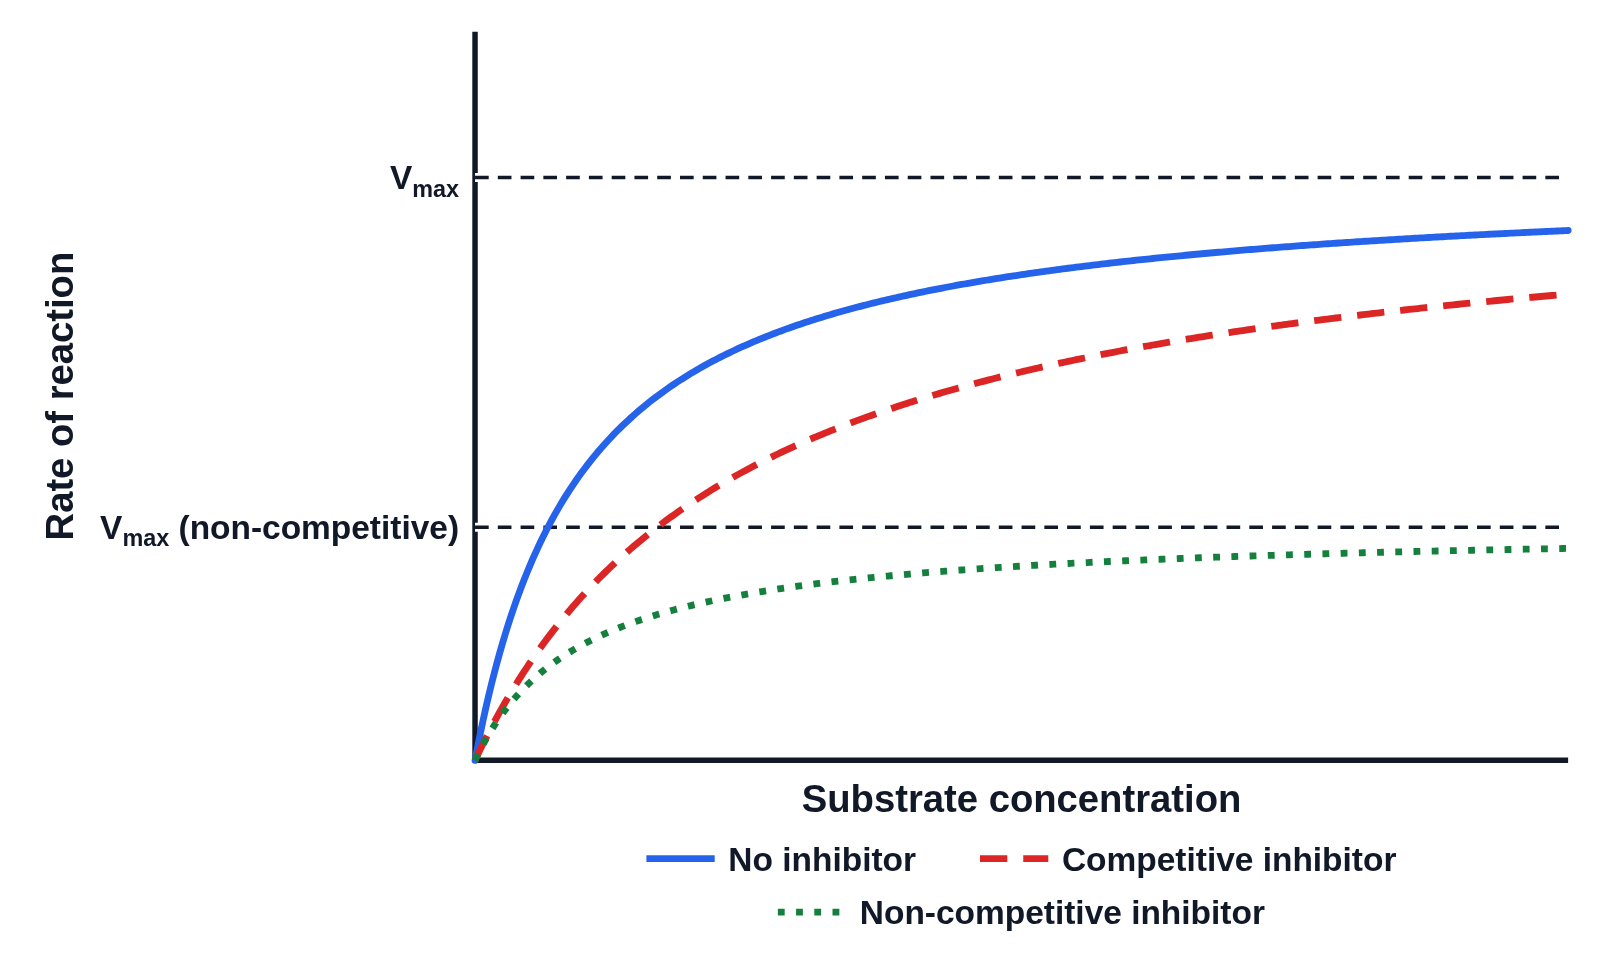
The rate of reaction against substrate concentration for an enzyme on its own (solid blue), with a competitive inhibitor (dashed red) and with a non-competitive inhibitor (dotted green), drawn as Michaelis–Menten curves. With a competitive inhibitor the rate climbs more slowly but reaches the same Vmax, since enough substrate outcompetes it; with a non-competitive inhibitor it levels off at a lower Vmax. Dashed lines across mark each Vmax, labeled at the y-axis: the enzyme’s own, which the competitive inhibitor shares, and the non-competitive inhibitor’s.