Enzyme activity against temperature: human enzyme and Taq polymerase

An example figure from the Enzyme Activity generator.
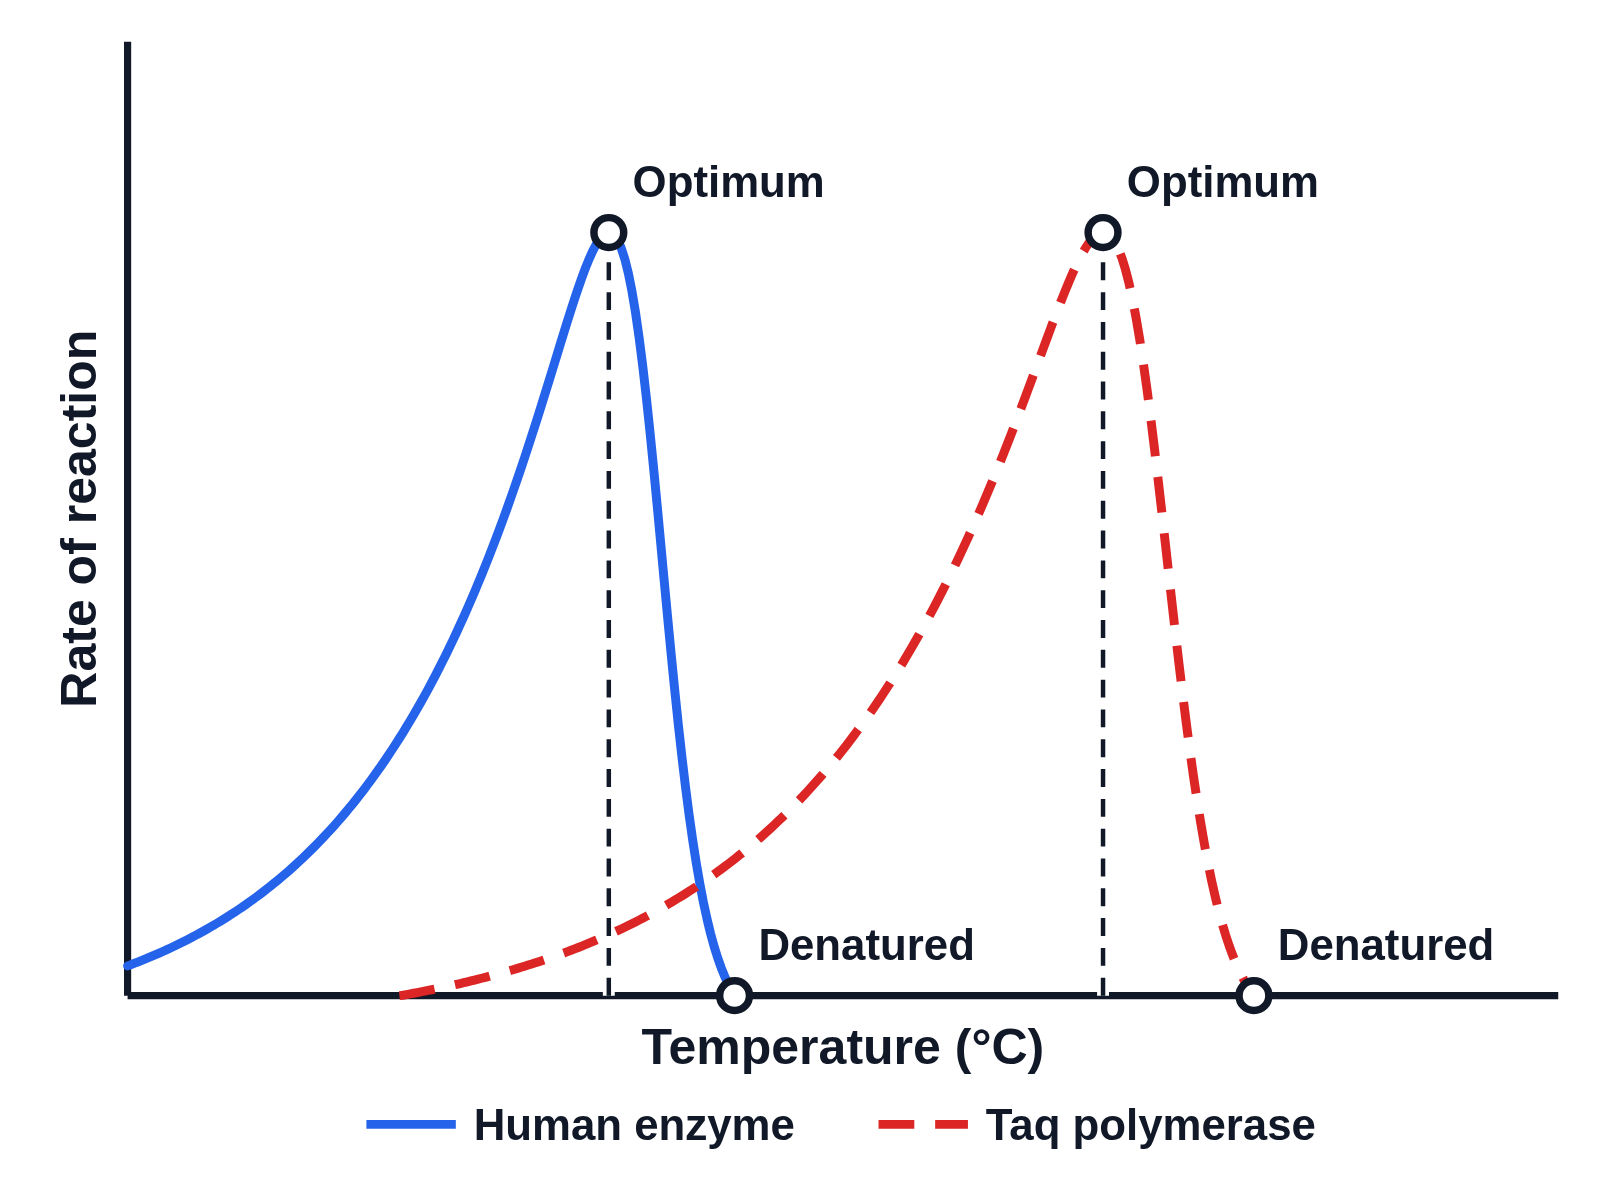
Graph of rate of reaction against temperature (°C) with no numbers on the axes: a solid blue curve for a human enzyme and a dashed red curve for Taq polymerase, each rising slowly to an optimum marked with a dot and a dashed line, labeled Optimum, then falling steeply to a dot on the axis labeled Denatured
The rate of reaction against temperature for an enzyme from the human body (solid blue) and Taq polymerase, from bacteria living in hot springs (dashed red). Each rate rises gently as the temperature goes up, peaks at the enzyme’s optimum, about 37 °C for the human enzyme and 75 °C for Taq polymerase, then falls steeply as the enzyme denatures. Dots mark each optimum, with a dashed line down to the temperature axis, and where each curve falls to zero.

Editing opens it in Enzyme Activity with these settings, to change anything and copy or download your own.

Answer key

  • Human enzyme: works best at 37 °C, and has denatured by 47 °C
  • Taq polymerase: works best at 75 °C, and has denatured by 87 °C

Free to use in your tests, worksheets, slides or anything else, no credit needed. Public domain under CC0 1.0. How to reuse our figures
More Enzyme Activity examples