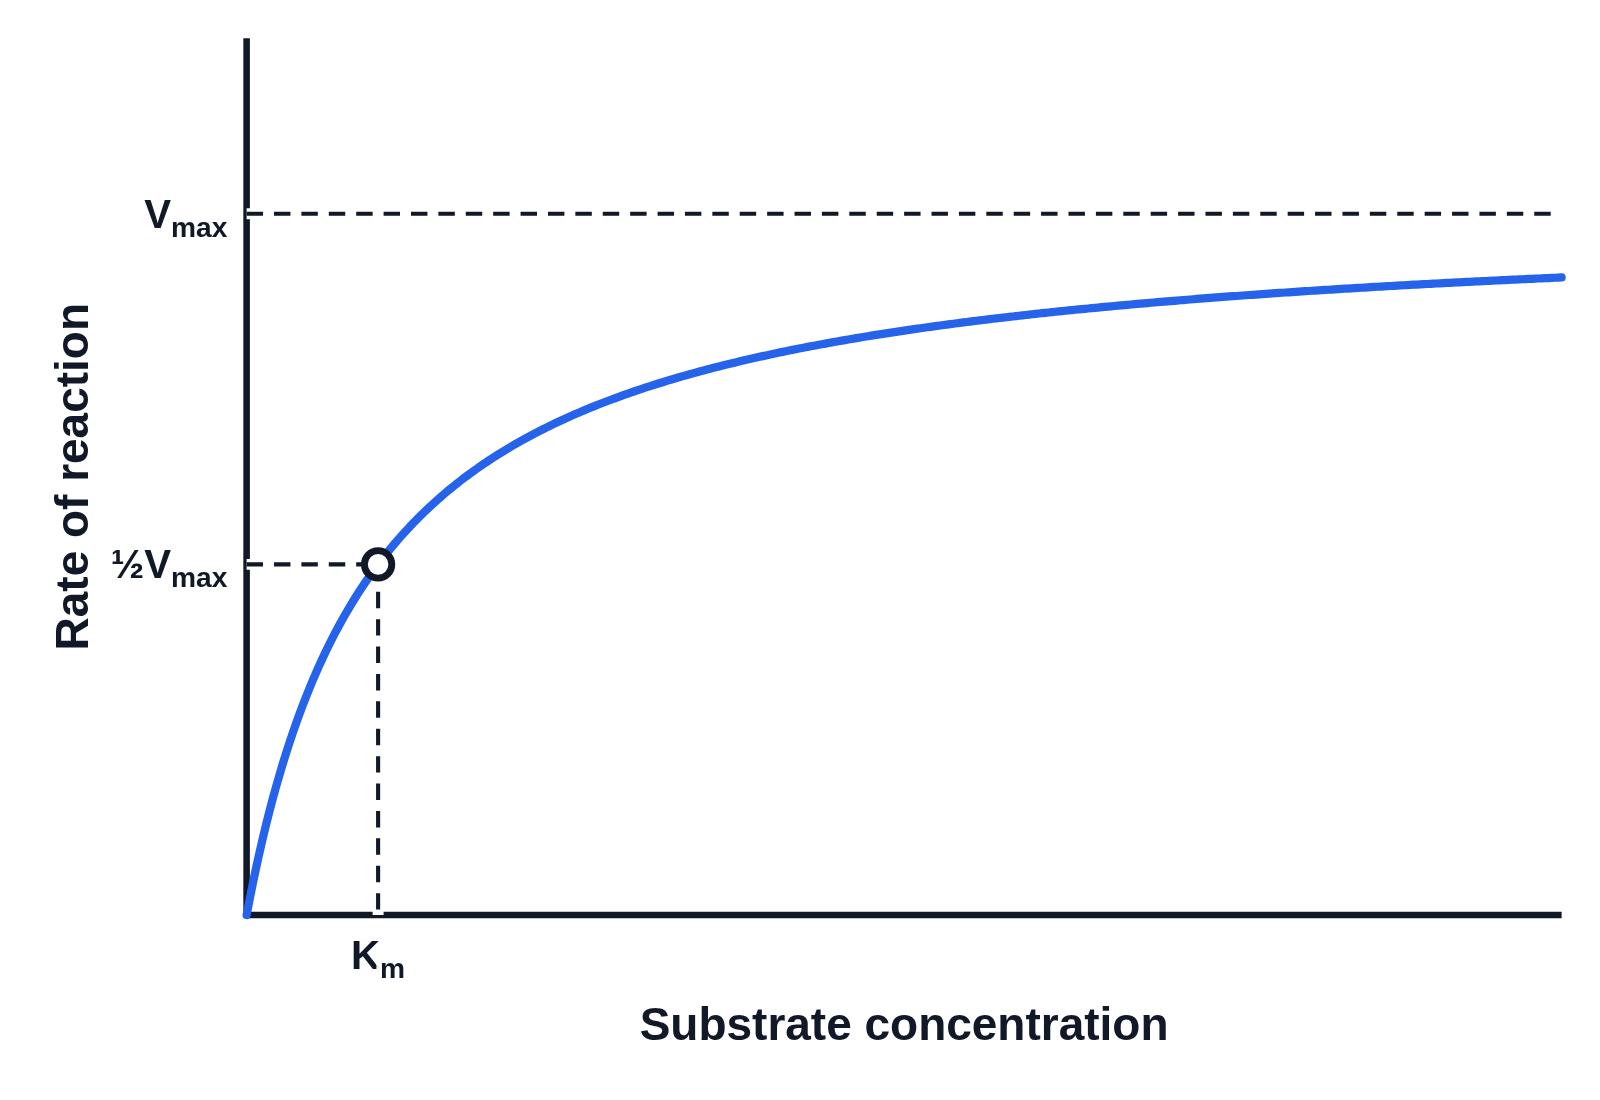
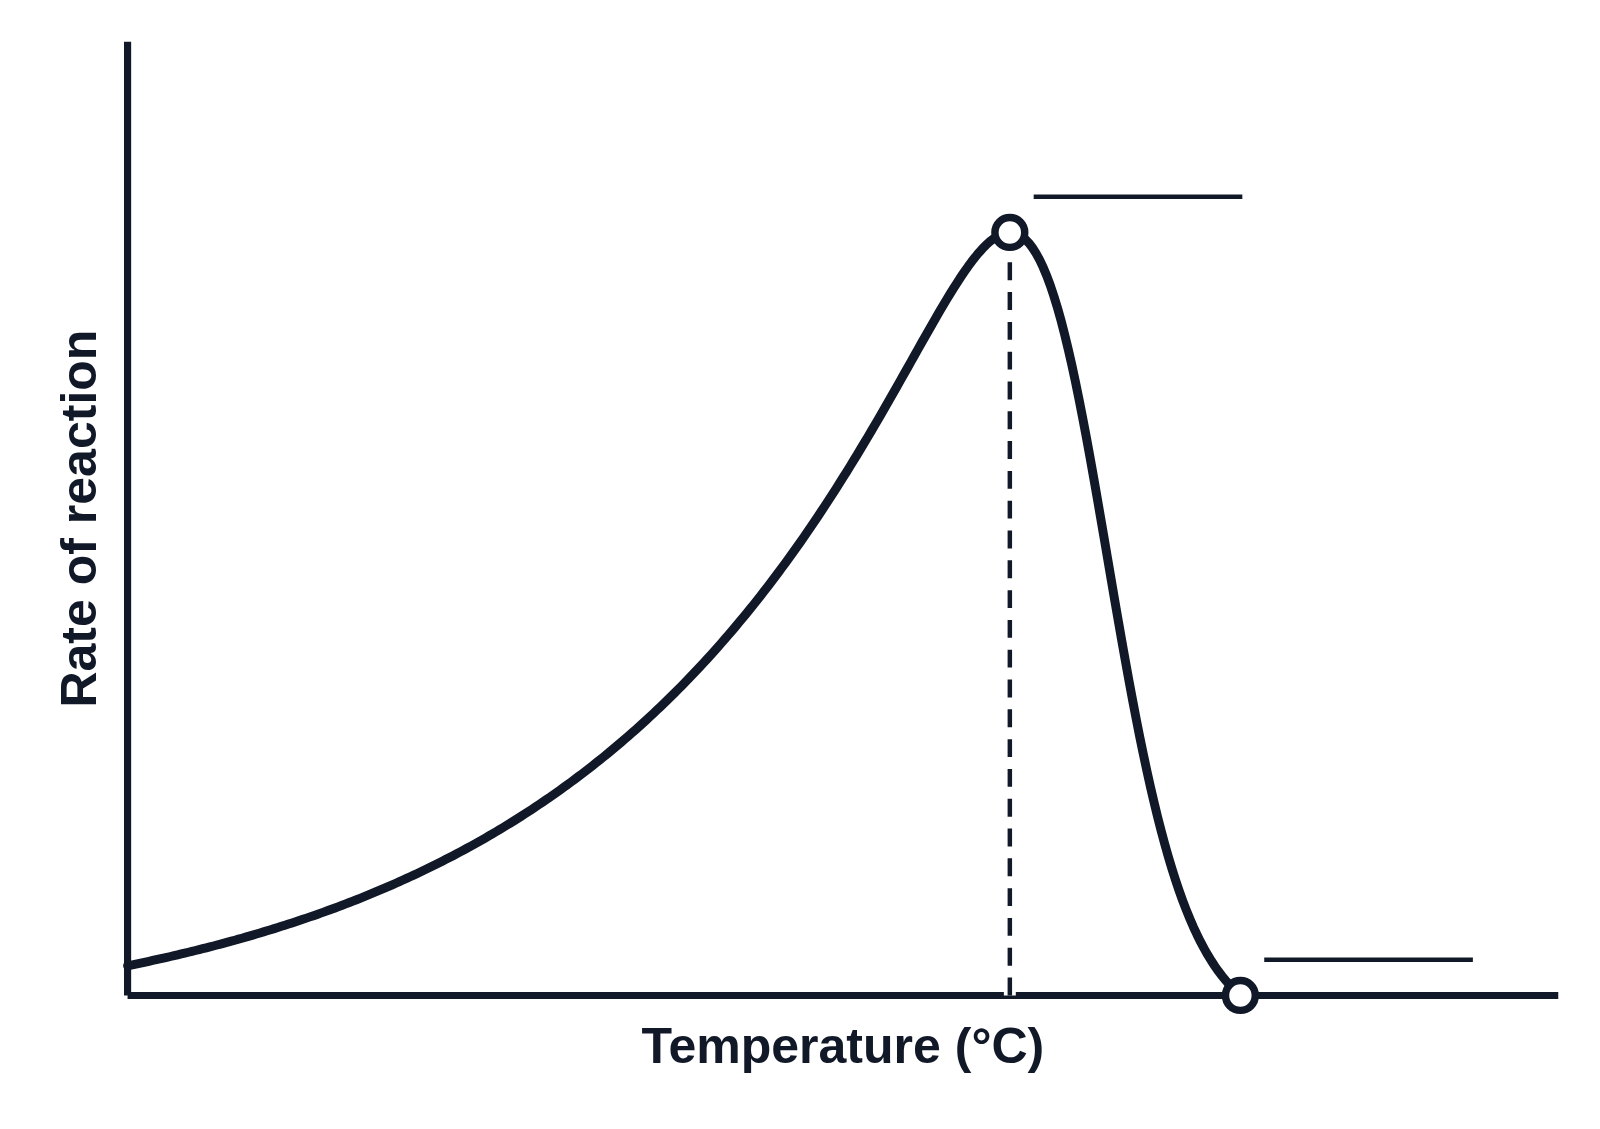
A Michaelis–Menten curve: the rate of an enzyme-catalysed reaction rises steeply as substrate is added, then levels off as every active site becomes busy. A dashed line across marks the top rate, Vmax. A dot marks where the rate is half of Vmax, with dashed lines across to the y-axis, labeled ½Vmax, and down to the substrate concentration that gives it, labeled Km.