Enzyme and temperature graph worksheet: label the optimum and denaturation

An example figure from the Enzyme Activity generator.
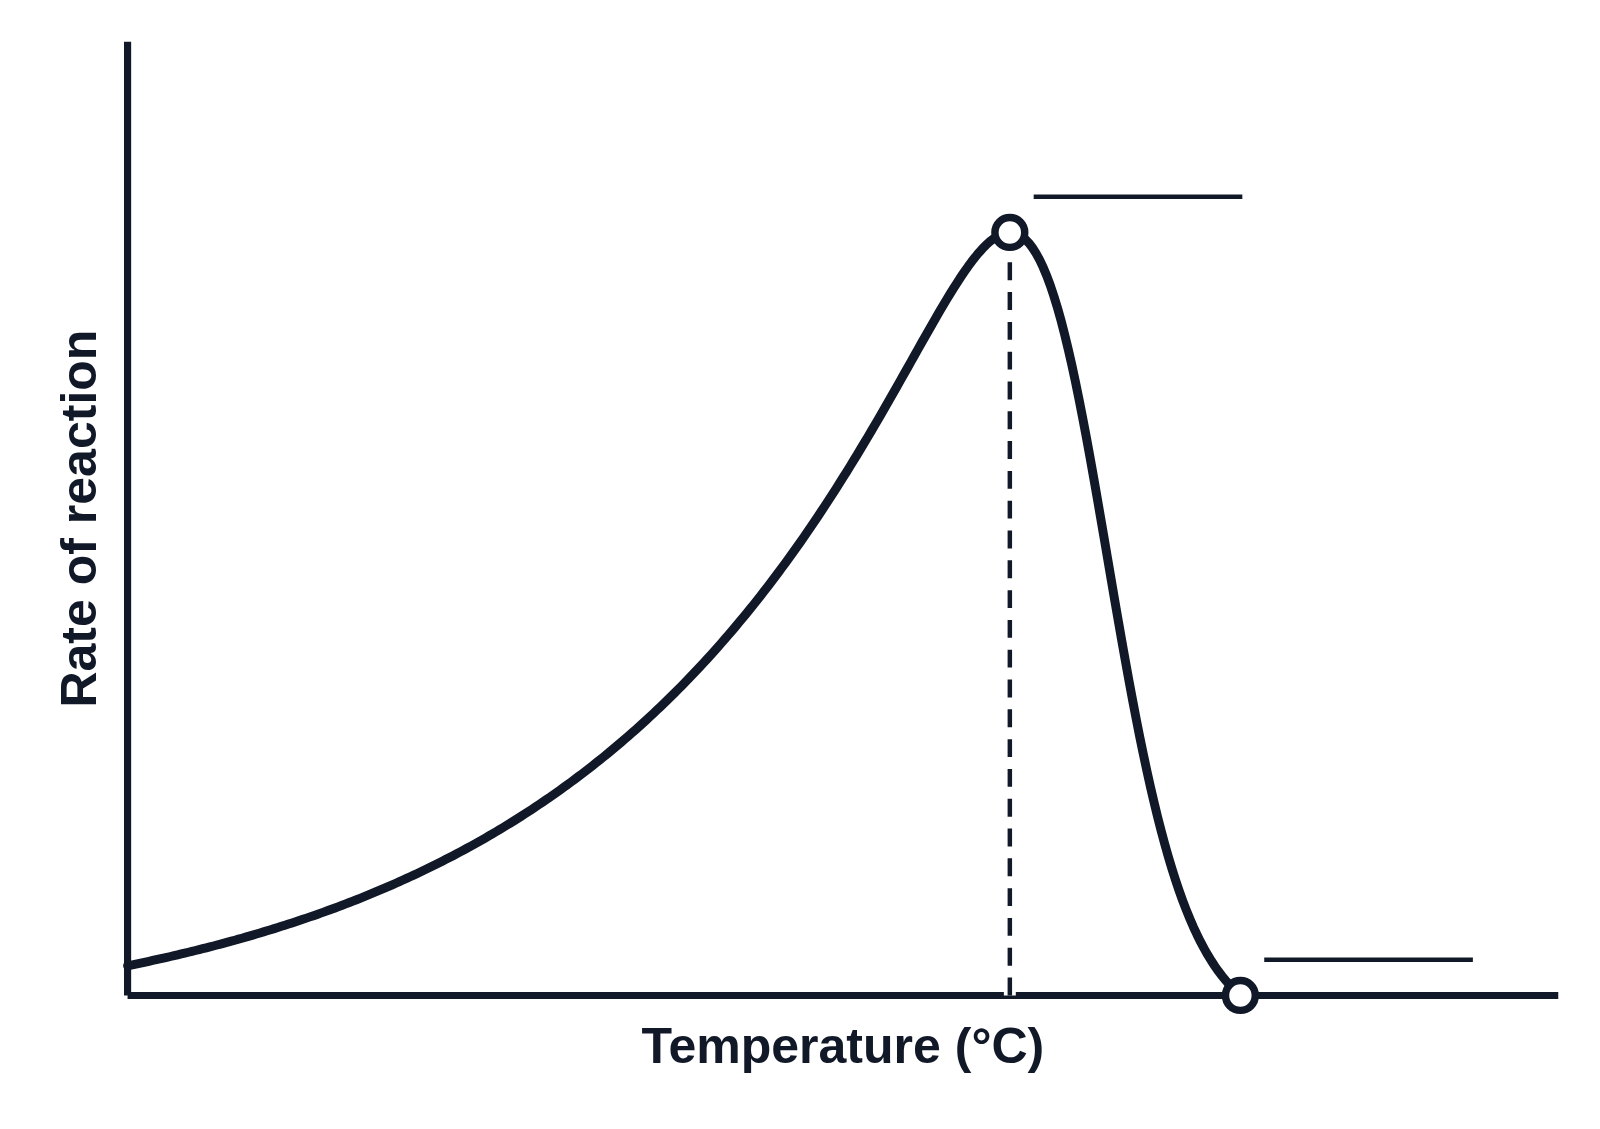
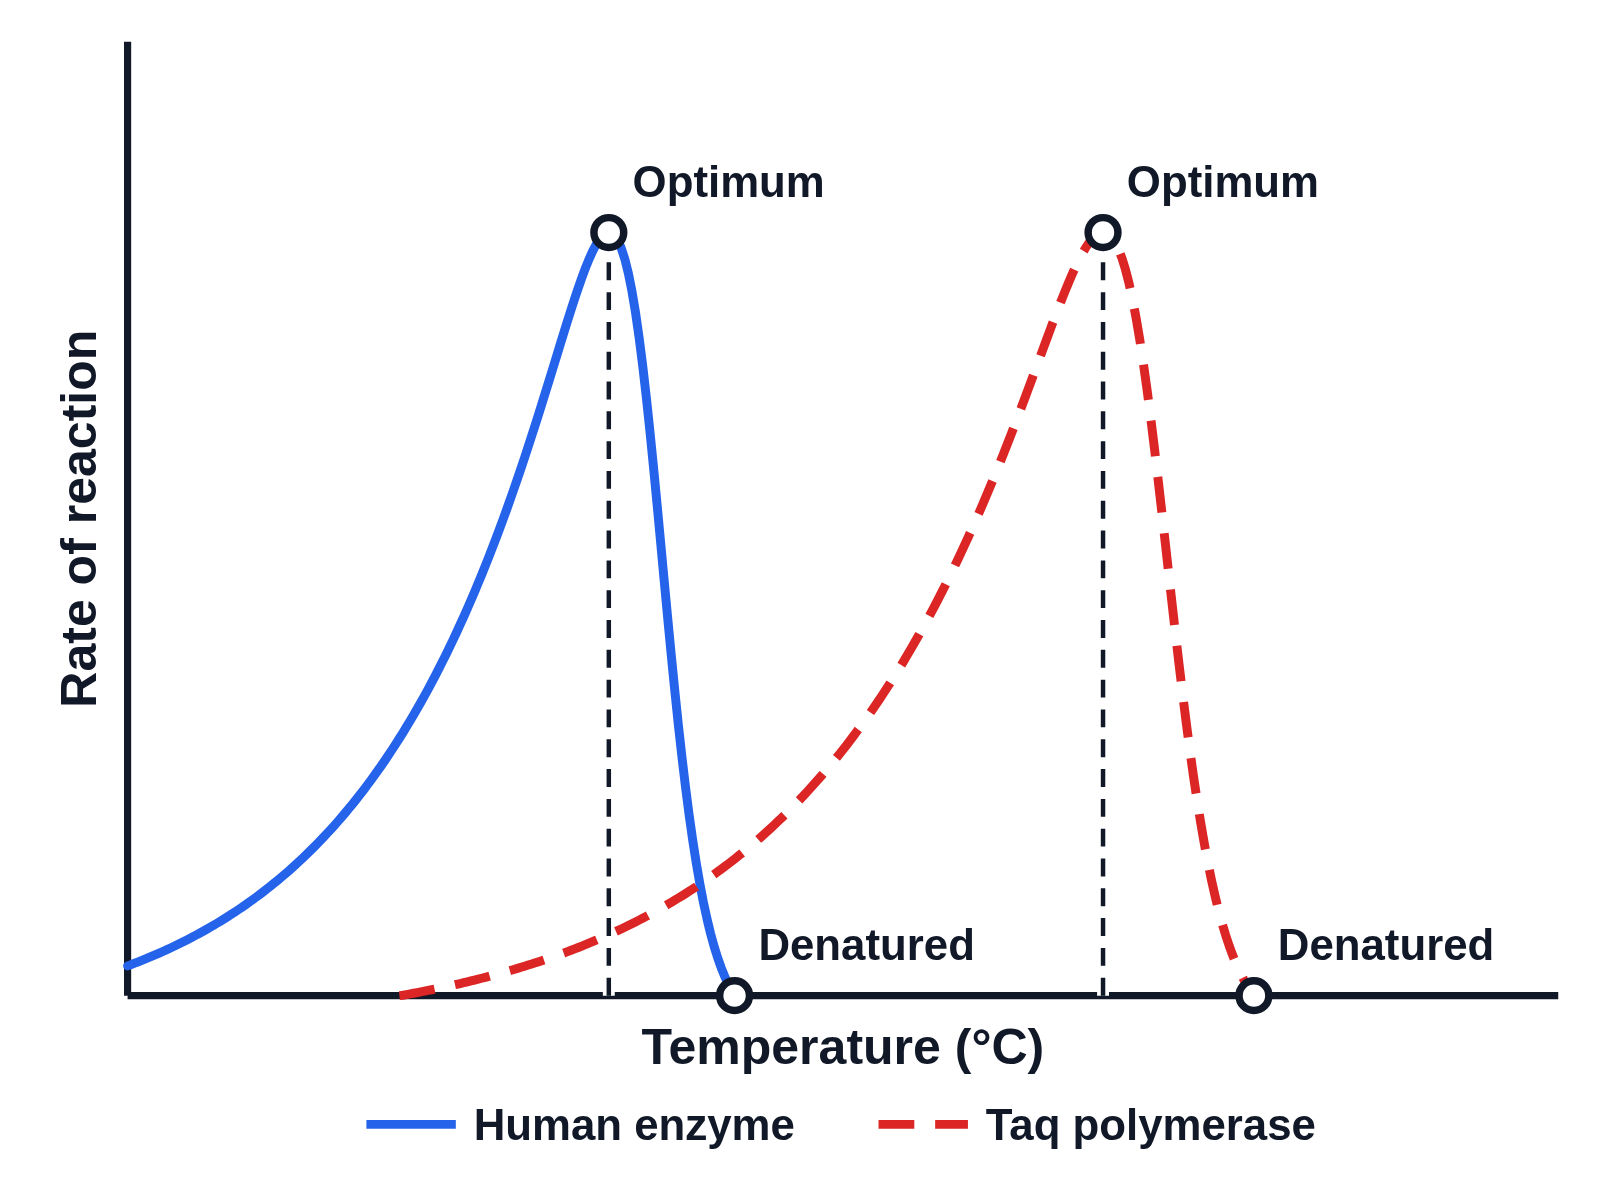
Black and white graph of rate of reaction against temperature (°C) with no numbers on the axes: one curve rising to a peak and falling steeply to the axis, a dot on the peak with a dashed line down and a dot where the curve meets the axis, each with a blank line for students to label
A worksheet graph of a human enzyme’s rate of reaction against temperature, in black and white with no numbers on the axes. The rate rises to a peak and then falls steeply to zero. A dot marks the peak, with a dashed line down to the temperature axis, and another marks where the rate reaches zero, each with a blank line for students to write what happens there.

Editing opens it in Enzyme Activity with these settings, to change anything and copy or download your own.

Answer key

  • Human enzyme: works best at 37 °C, and has denatured by 47 °C

Free to use in your tests, worksheets, slides or anything else, no credit needed. Public domain under CC0 1.0. How to reuse our figures
More Enzyme Activity examples