Blank population growth graph for students to draw on

An example figure from the Population Growth generator.

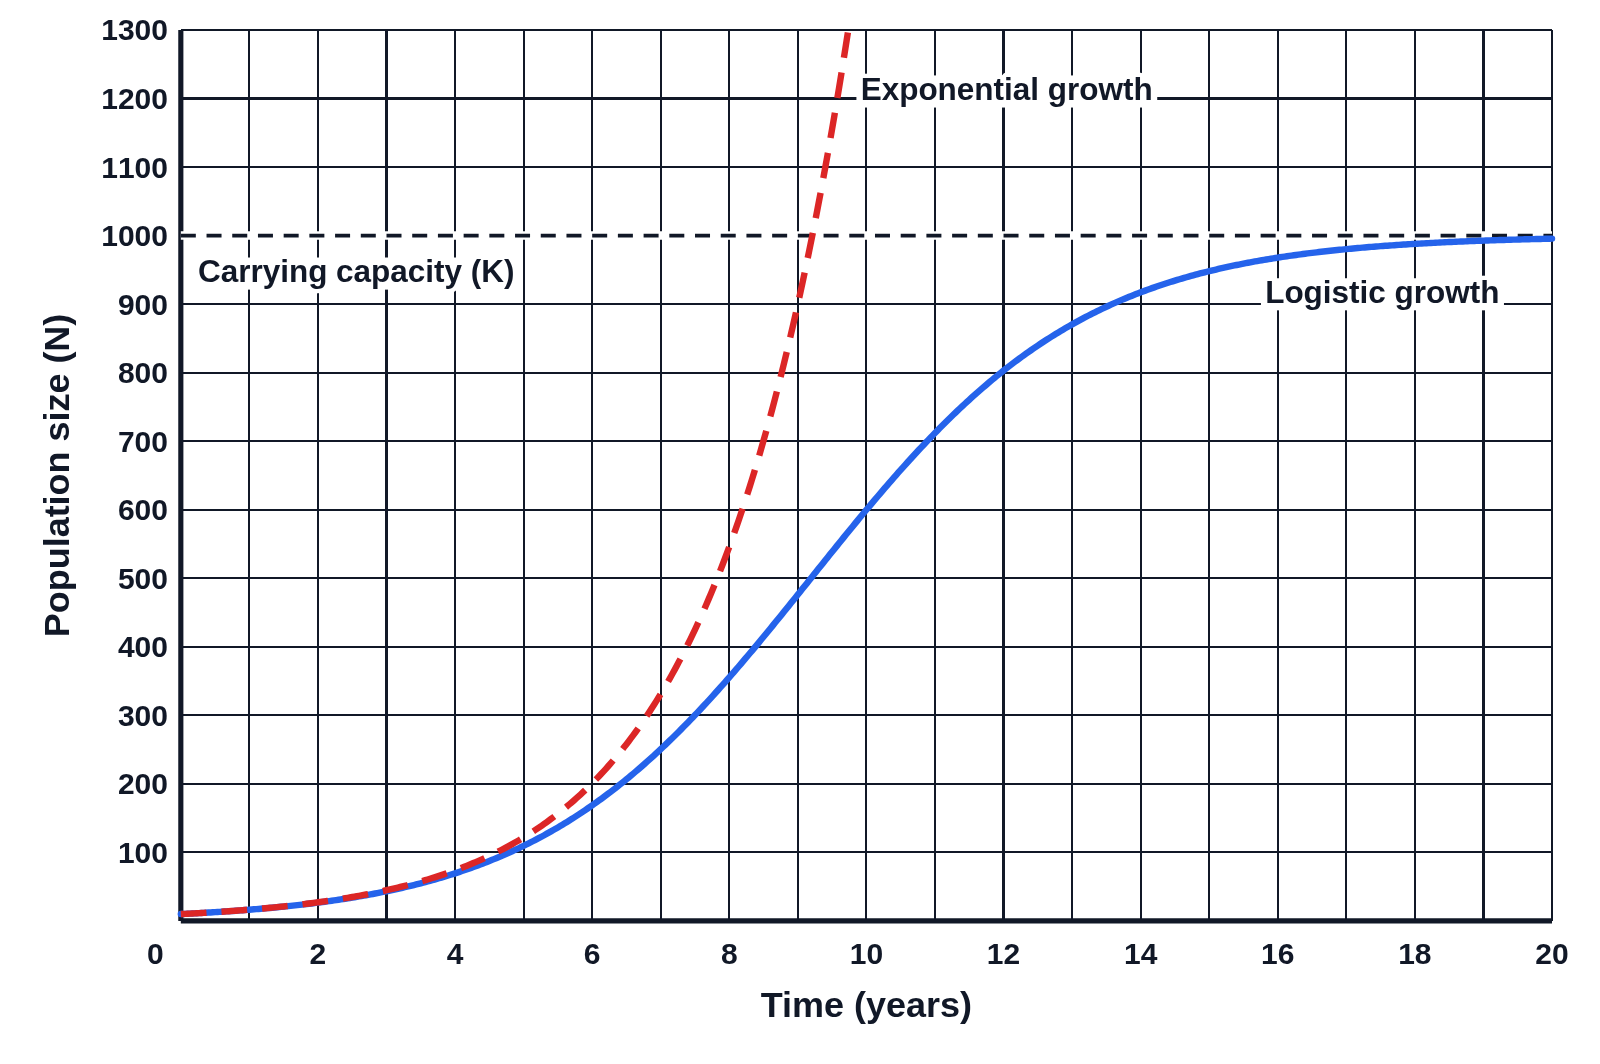
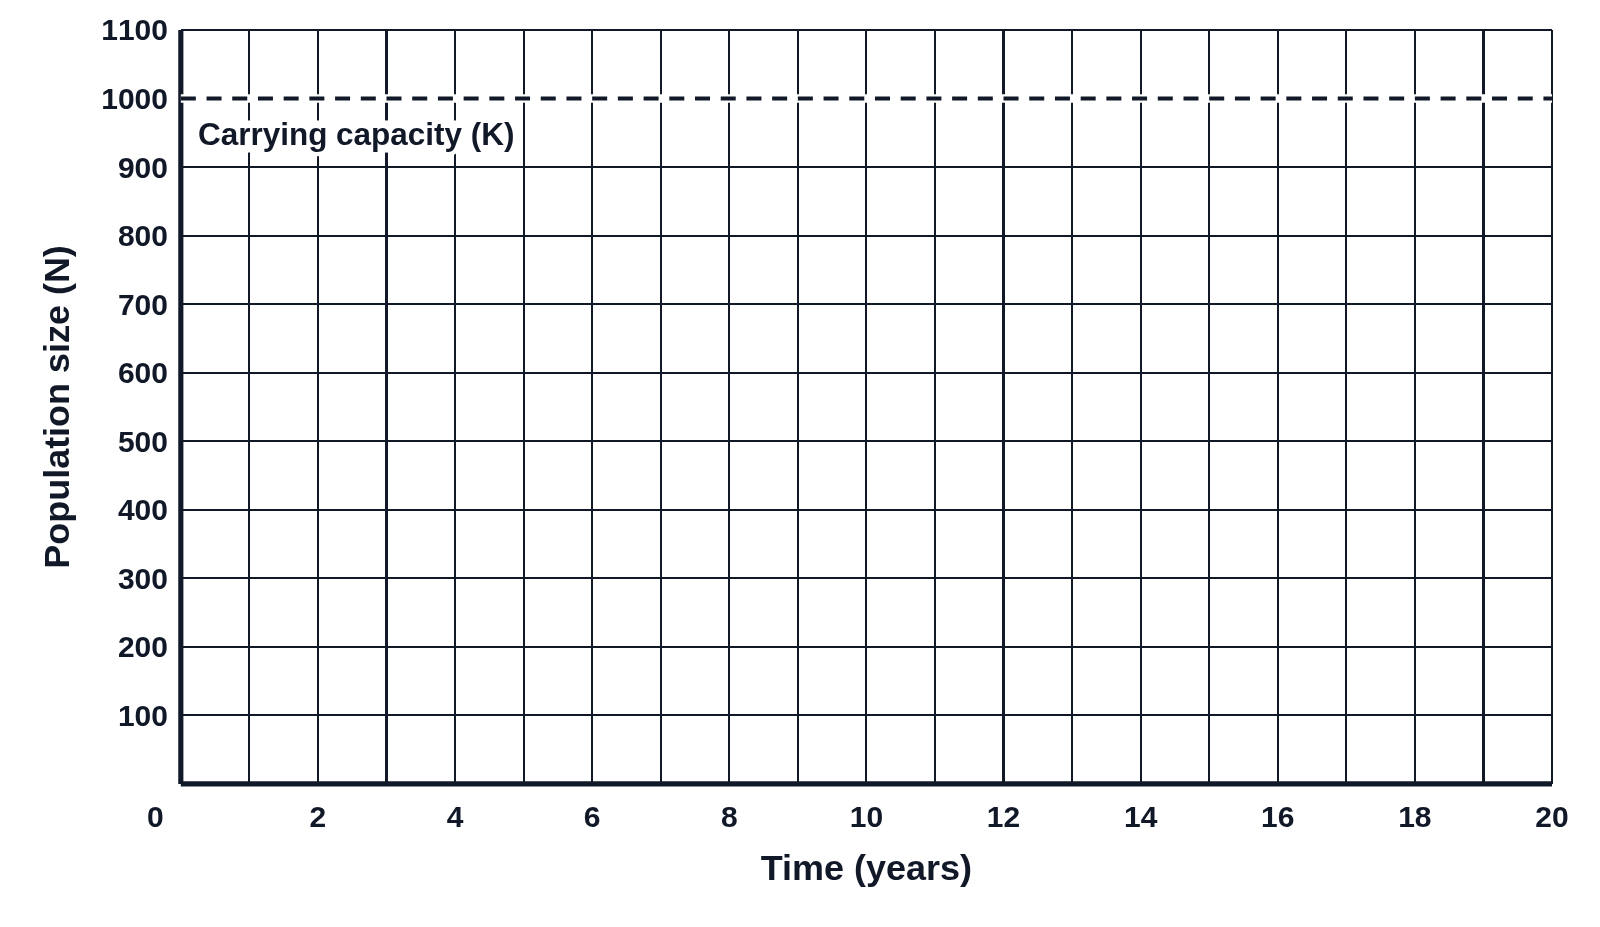
Blank graph of population size (N) from 0 to 1100 against time in years from 0 to 20, with only a dashed line at 1000 labeled Carrying capacity (K)
Empty axes for students to sketch a population’s growth: population size (N) up to 1100 against time from 0 to 20 years. Only the carrying capacity is drawn, a dashed line at 1000 labeled Carrying capacity (K), so students can draw the S-curve leveling off at it, or an exponential J-curve to compare.

Editing opens it in Population Growth with these settings, to change anything and copy or download your own.

Free to use in your tests, worksheets, slides or anything else. Open source under Apache 2.0. How to reuse our figures

More Population Growth examples