Yeast population growth curve with census data and growth phases

An example figure from the Population Growth generator.

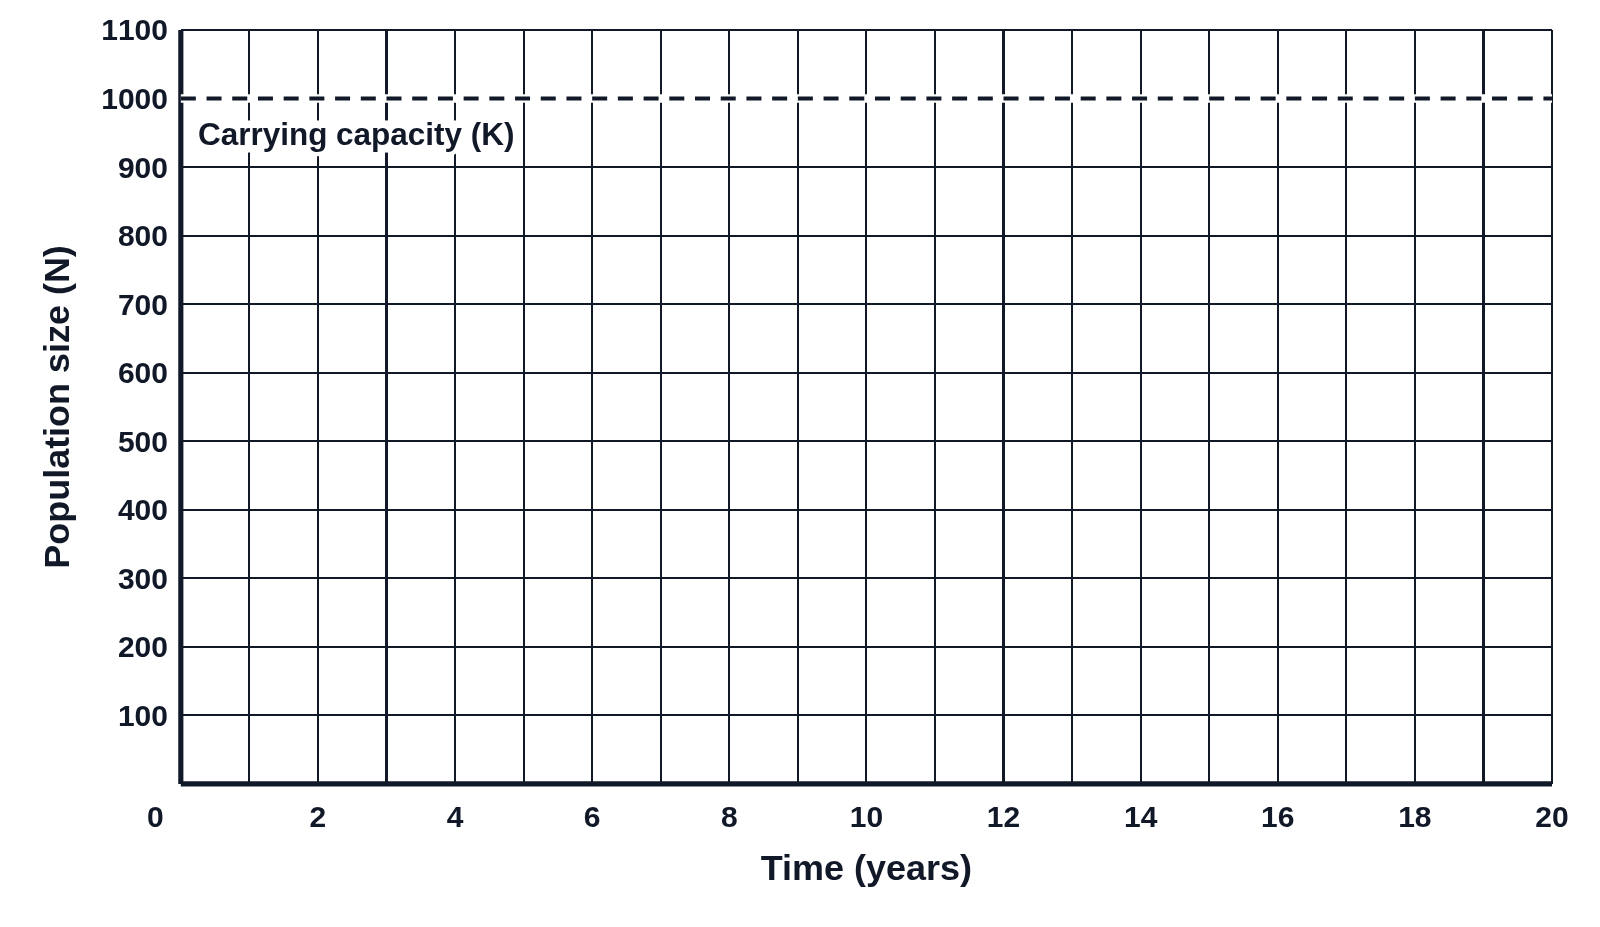
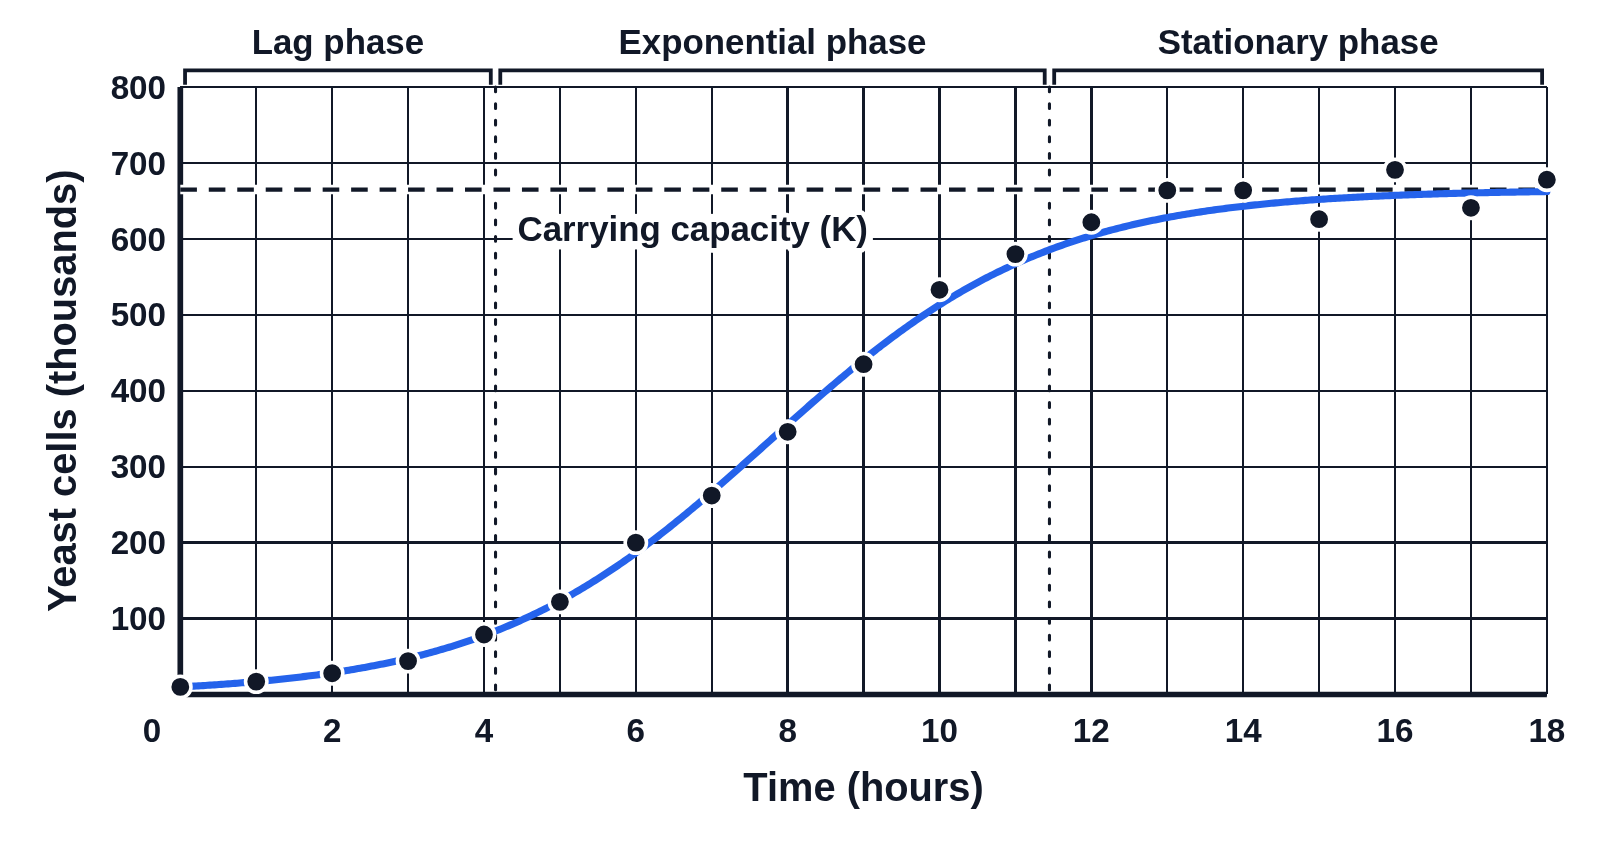
Logistic growth curve of yeast cells in thousands over 18 hours with hourly census dots scattered near it, a dashed carrying capacity line at 665, and brackets above labeled Lag phase, Exponential phase and Stationary phase
Yeast growing in a flask over 18 hours, from 10 thousand cells at 0.54 per hour toward a carrying capacity of 665 thousand. Census counts taken every hour are scattered by about 5% around the logistic curve, like real lab data. Brackets above the graph mark the lag, exponential and stationary phases, with dotted lines down the graph where each ends.

Editing opens it in Population Growth with these settings, to change anything and copy or download your own.

Free to use in your tests, worksheets, slides or anything else. Open source under Apache 2.0. How to reuse our figures

More Population Growth examples