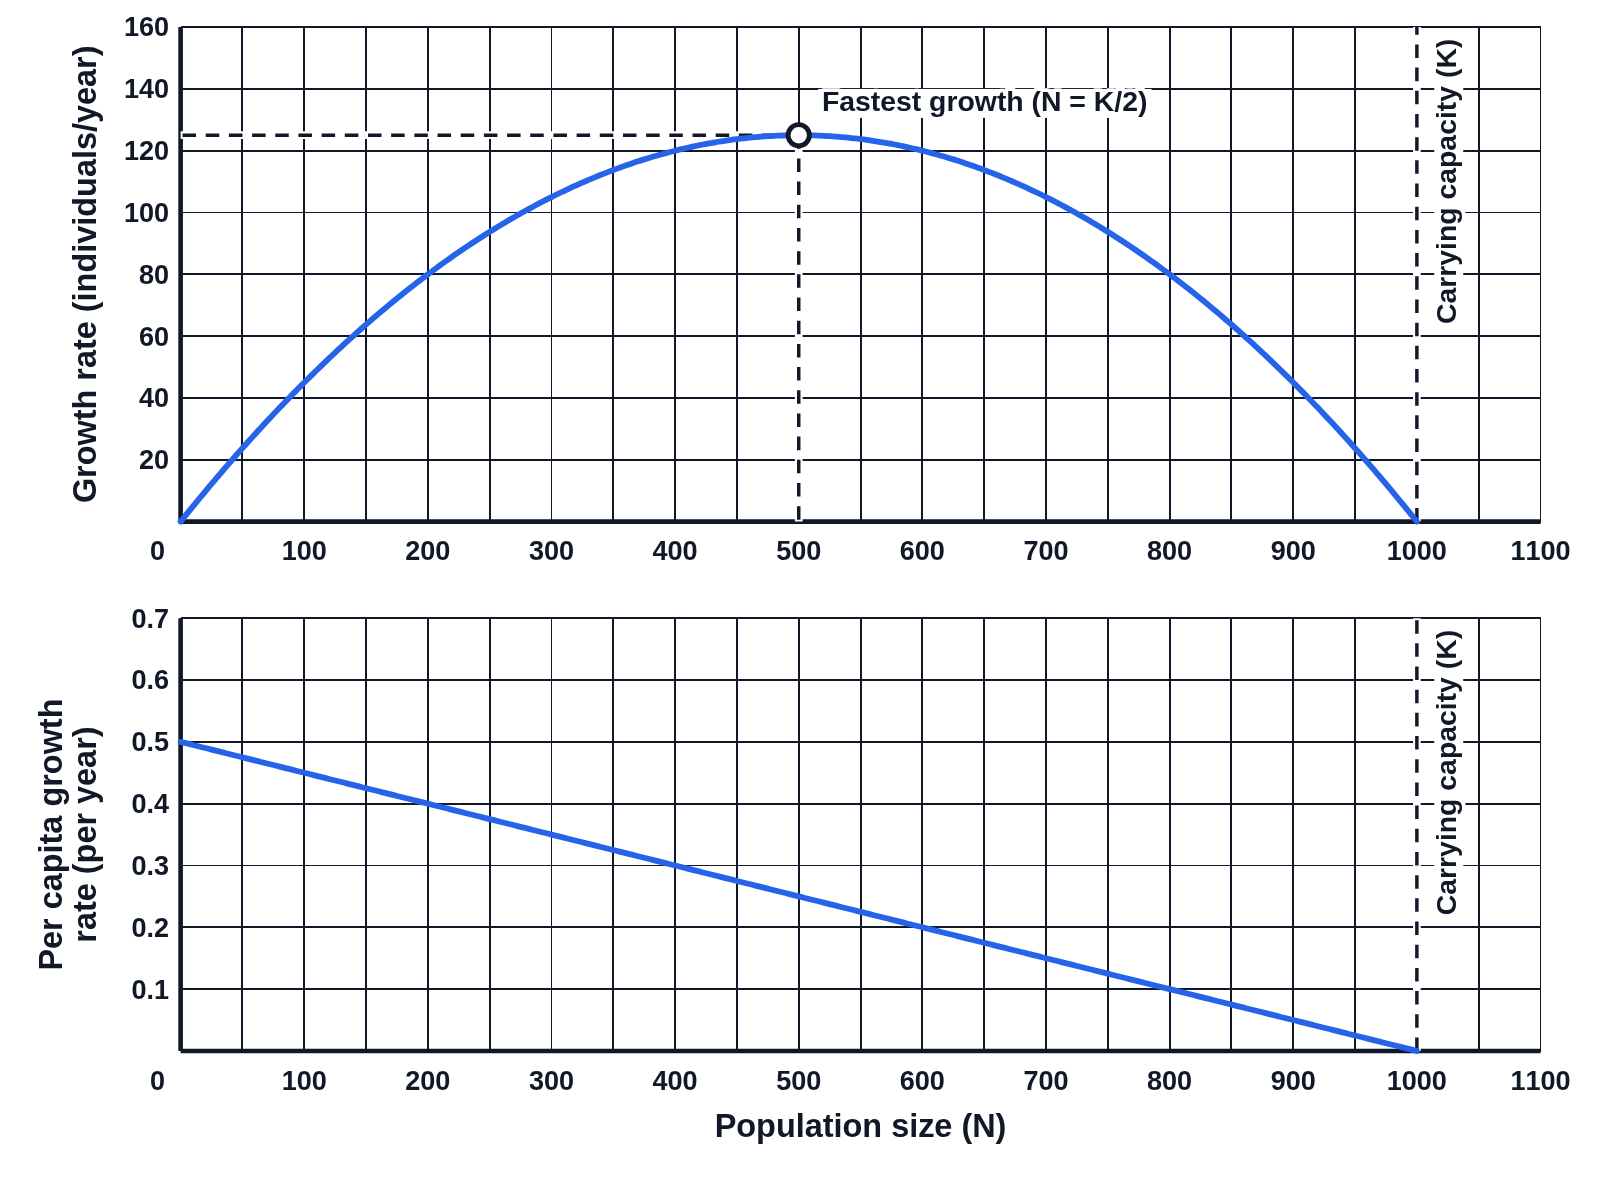
Growth rate and per capita growth rate vs. population size

An example figure from the Population Growth generator.

Two stacked graphs against population size N from 0 to 1100: the growth rate dN/dt as a hump peaking at 125 individuals per year at N = 500, labeled Fastest growth (N = K/2), and the per capita growth rate falling in a straight line from 0.5 to 0, with a dashed carrying capacity line at 1000 on both
Logistic growth with r = 0.5 per year and K = 1000, graphed against population size. On top, the growth rate dN/dt is a hump that is 0 at N = 0 and at K, with its peak marked at N = K/2. Below, the per capita growth rate falls in a straight line from 0.5 to 0 at the carrying capacity, which is a dashed line on both graphs.

Editing opens it in Population Growth with these settings, to change anything and copy or download your own.

Free to use in your tests, worksheets, slides or anything else. Open source under Apache 2.0. How to reuse our figures

More Population Growth examples